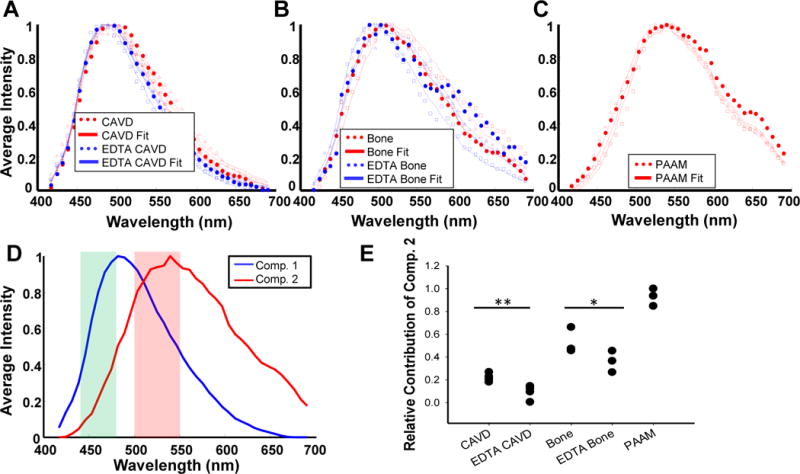
Figure 4.

Analysis of TPEF emission spectra reveals emission spectrum of mineralization associated fluorescence. Representative TPEF emission spectra of (A) human CAVD valves before and after EDTA treatment, (B) rat bone before and after EDTA treatment, and (C) nodules grown on PAAM gels indicate a blue shift with EDTA treatment. For A-C, representaive data sets are delineated using either triangles, squares, or dots; representiave fits are shown using a solid line. Spectral unmixing through non-negative matrix factorization indicated two spectral components (D), which provided a good fit to the data in A-C. Shaded regions in (D) represent the emission filter bands employed in TPEF imaging. (E) The relative contribution of component 2 derived from spectral unmixing and associated with mineralization is reduced upon EDTA treatment (*P=0.088, **P<0.001 based on ANOVA and post-hoc Tukey test). Averaged spectra are shown from 4 CAVD valves, 4 CAVD EDTA valves, 3 bone samples, 3 EDTA bone samples, and 3 PAAM gel nodules.
