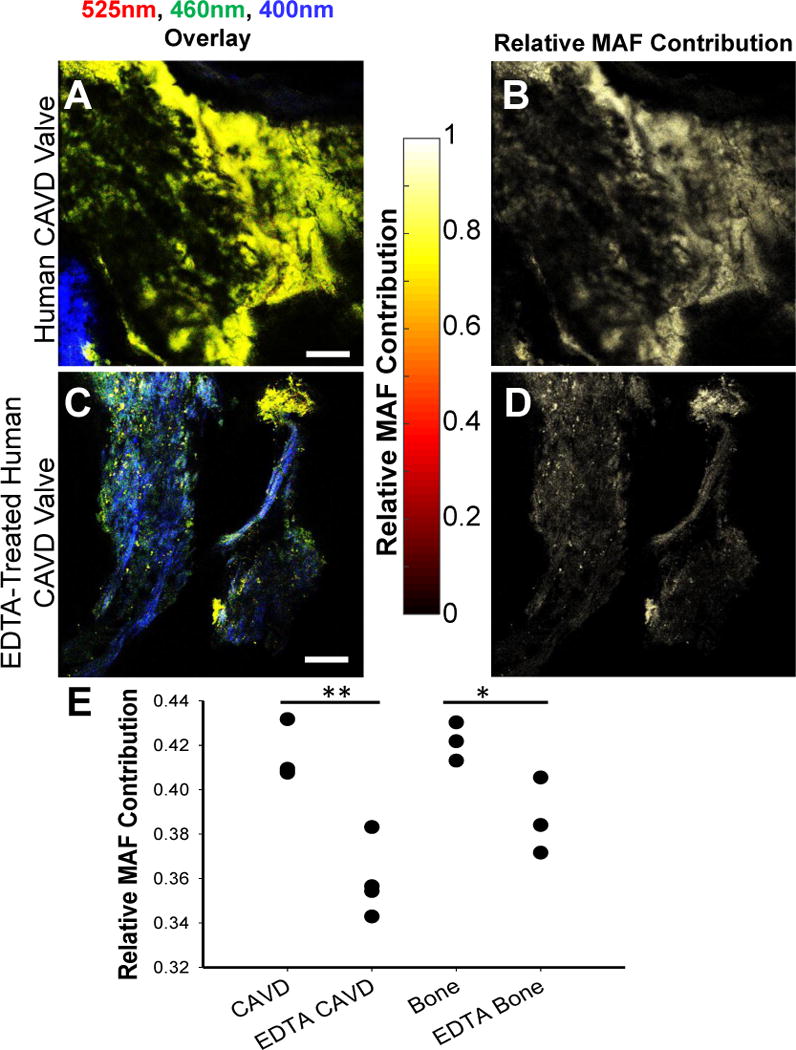
Figure 5.

MAF images enable enhanced visualization of mineralized sample regions. Human CAVD valve (A) intensity overlay of 525nm TPEF (red), 460nm TPEF (green), and SHG (blue), as well as (B) calculated MAF images. EDTA treatment causes an overall reduction in TPEF intensity (C) and a reduction in the relative 525nm emission resulting in a lower MAF contribution (D). The relative MAF contribution (E) is significantly decreased with EDTA treatment to remove calcification (*P=0.002; **P=0.045 based on ANOVA and post-hoc Tukey Test). Data is shown from 4 CAVD and CAVD EDTA samples and 3 bone and EDTA bone samples. Scale bar is 100 μm.
