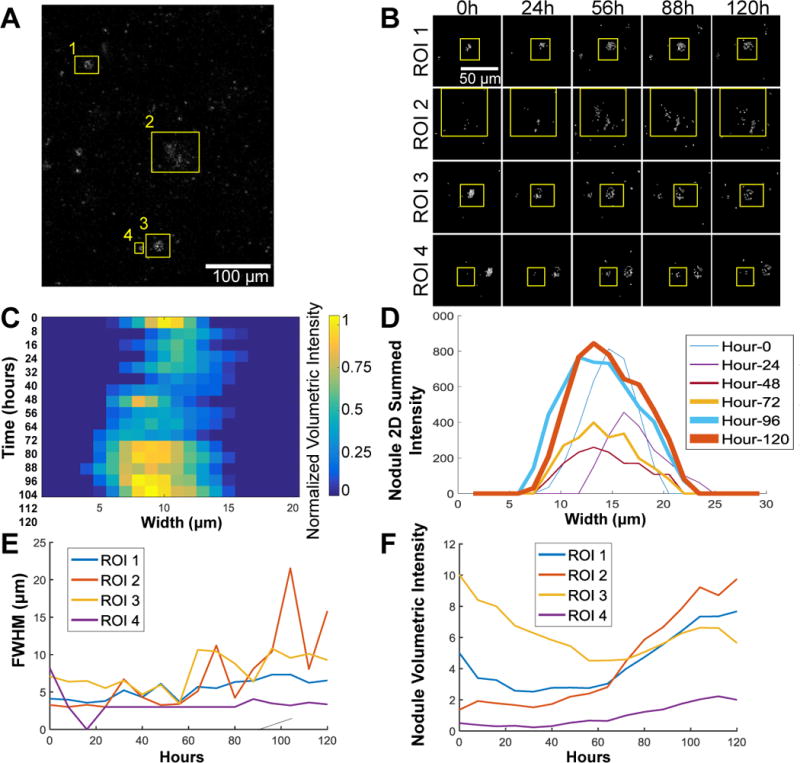
Figure 8.

Time lapse experiment of calcification on PAAM gels shows measured change in nodule size. (A) The 525nm/460nm image ratio at time zero of a 120 hour time lapse experiment showing 4 regions of interest (ROIs) used for analysis. (B) Representative time points of each ROI showing the regions that were analyzed. After taking the summed 3D projections and the 525nm/460nm ratio and calculating the MAF contribution, the sum along the image plane can be used to find the nodule volumetric intensity shown for the image stacks (B) and the individual line plots for the nodule volume over time (C). These images were then used to calculate the full with at half maximum (FWHM; E) and the area under the curve of the intensity profile of the 3D summed projections, or the volumetric intensity (F).
