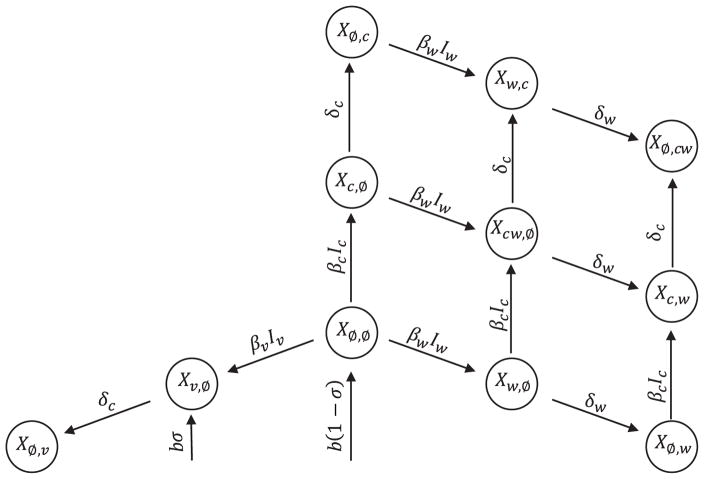
Fig. 4. Flow diagram of the model describing the vaccine, vector, and pathogen when vector/vaccine cross-immunity is perfect.
State variables are notated XI,J, where infection and immunity status are described by the subsets I, J ⊂ {Ø, c, v, w}. We assume individuals infected with the vaccine recover at the same rate as those infected with the vector. Note that death rates are omitted.

