. 2018 Jan 22;7:e31511. doi: 10.7554/eLife.31511

Figure 1. Hearing phenotype of C57BL6/J-129Sv Slc7a8 knockout mice.

(A) Representative image of western bloting of total membranes from kidney, brain and intestine of wild-type (+/+) and Slc7a8 knock out (-/-) mice in the absence (-) or presence (+) of 100 mM dithiothreitol reducing agent (DTT) of three independent biological samples for both sexes (male and female). Protein (50 μg) were loaded in 7% acrylamide SDS-PAGE gel. Molecular mass standard (KDa) are indicated. Red arrows point SLC7A8/CD98hc heterodimer band as well as the light subunit SLC7A8. Upper panel: Rabbit anti-SLC7A8. Bottom panel: Mouse anti-βactin. (B) Pre-Pulse Inhibition of the acoustic startle response (PPI). Mean and SEM are represented. Pulse: 120 dB single pulse. Pre-pulse inhibition test: six different pre-pulse intensities (70 to 90 dB) in pseudo random order with 15 s inter-trial intervals. Wild type (white circles, n = 19) and Slc7a8 −/− (blue circles, n = 15) from 4- to 7-month-old are represented. Significant differences were determined using paired Student’s t-test, ***p<0.001 (C–F) Hearing phenotype in wild-type (Slc7a8+/+, white, n = 11), heterozygous (Slc7a8+/−, green, n = 12) and knockout (Slc7a8−/−, blue, n = 14) mice, grouped by age (4–6 and 7–13 month old). (C,D) Auditory Brainstem Response (ABR) threshold in response to click, expressed as mean ±standard error (C), individual value (scatter plot, (D) and median (boxplot, (D). The significance of the differences was evaluated using ANOVA test, *p<0.05, **p<0.01 (Slc7a8−/− versus Slc7a8+/+) and # p<0.05 (Slc7a8−/− versus Slc7a8+/−). (E) Pie plot showing the percentage of normal hearing (all thresholds <45 dB SPL, white) mice and mice with mild (at least two tone burst threshold >45 dB SPL, orange) and severe (at least two tone burst threshold >60 dB SPL, red) hearing loss (HL), within each genotype and age group. (F) ABR thresholds in response to click and tone burst stimuli (8, 16, 24, 32 and 40 kHz) in mice from three genotypes separated by age group and hearing phenotype (normal hearing or hearing loss). Significant differences were determined using ANOVA test, *p<0.05, **p<0.01, ***p<0.001 (hearing impaired Slc7a8−/− versus normal hearing Slc7a8+/+) and # p<0.05 (hearing impaired Slc7a8−/− versus Slc7a8+/−).

Figure 1.

Figure 1—figure supplement 1. Scheme of Slc7a8 knockout mouse generation.

Figure 1—figure supplement 1.

(A) Diagram of the homologous recombination in Slc7a8 locus, the vector used to replace the coding region of the gene for a neomycin (Neo) resistance and the resulting recombinant locus. (B) Scheme of LAT2 protein, in gray deleted region in the Slc7a8 −/− mouse and in red is represented the epitope which anti-SLC7A8 antibody was generated.
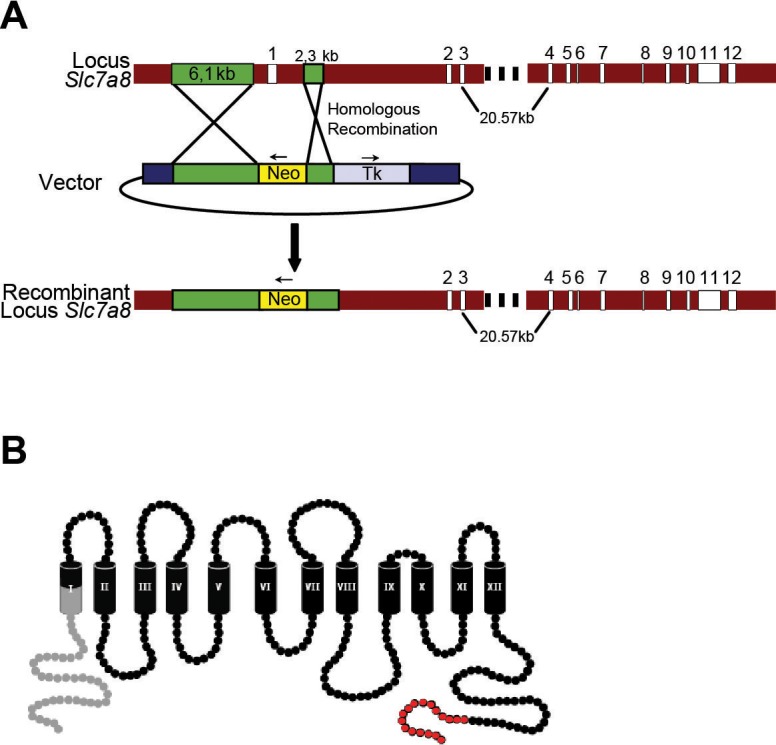
Figure 1—figure supplement 2. SLC7A8 expression in mouse brain.

Figure 1—figure supplement 2.

(A) Wild-type mouse brain immunohistochemistry against SLC7A8 in wild type 4- to 7 months of age in mixed C57BL6/J-129Sv genetic background mice. Arrow is pointing SLC7A8 expression in cell membranes. (1) Cerebral cortex, SLC7A8 expression is localized to apical dendrites and synaptic area. (2 and 3) Preoptic Area. SLC7A8 expression in fibers. (4) Hypophysis. (5) Brain blood vessel. (6) Subfornical organ. (7) Choroid plexus. (B) Representative Image from the scan (Nanozoomer, Hamamatsu Photon) of the whole cochlea immunofluorescence. SLC7A8 (green), phalloidin (red) and DAPI (blue) markers of wild type (upper row) and Slc7a8−/− (bottom row) adult mice (4- to 7 months of age in mixed C57BL6/J-129Sv genetic background) are represented. The selected spiral ganglion areas (orange square) are magnified on the right, where white arrow points SLC7A8 signal in the spiral ganglia neurons that is specific as it fades completely in the Slc7a8−/− mice. Scale bar 100 μm.
Figure 1—figure supplement 3. Behavior phenotype.

Figure 1—figure supplement 3.

(A to G) Behavior tests data (mean ±SEM) of wild type (open circles) and Slc7a8−/− (black circles) mice of 4- to 7 months of age in mixed C57BL6/J-129Sv genetic background. (A) Latency to fall off the rod in the rotarod test at increasing fixed rotating speed (rpm) (n = 16 wild type and 14 Slc7a8−/−); (B and C) Time of exposure to shock in the treadmill test. Higher values indicate poorer performance (n = 8 wild type and 8 Slc7a8−/−). (D to F) Morris Water Maze (MWM) test of 5 wild type and 8 Slc7a8−/− mice. (G) Represents Rotarod Acceleration Time from 4 to 40 rpm in 60 s. Unpaired Student’s t-test statistical analysis, p-value: *, ≤0.05. (H) Western blot against SLC7A8 of 50 µg of total membranes from hypophysis of wild type (+/+), Slc7a8+/− (+/-) and Slc7a8−/− (-/-) mice. Kidney sample from wild-type mice was used as a positive control. Samples were loaded in 7% acrylamide SDS-PAGE gel in non-reducing conditions. SLC7A8/CD98hc heterodimers (120 kDa) were detected. (I) Plasma corticosterone levels after acute stress. Data (mean ±SEM) from four wild type (open bars) and 5 Slc7a8−/− mice (black bars) are represented. Basal: time 0, Stress: just after mice were exposed to a 15 min restraint stress and Recovery: 90 min after the stress.
Figure 1—figure supplement 4. ABR latencies and amplitudes of C57BL6/J-129Sv Slc7a8 knockout mice.

Figure 1—figure supplement 4.

(A) Representative ABR recordings in response to click at decreasing intensities from 90 to 10 dB SPL from wild type (Slc7a8+/+, white, n = 11), heterozygous (Slc7a8+/−, green, n = 12) and knockout (Slc7a8−/−, blue, n = 14) mice, grouped by age (4–6 and 7–13 month old). ABR waves I to IV are indicated and thresholds highlighted in bold. Detail of the first ms of the ABR recording in response to 70 dB SPL click showing the differences in the wave I latency and amplitude among genotypes (dashed lines). (B–E) Latency and amplitude of ABR waves, expressed as mean ±SE, in wild type (Slc7a8+/+, white, n = 14), heterozygous (Slc7a8+/−, green, n = 12) and knockout (Slc7a8−/−, blue, n = 11) separated by age group (4–6 and 7–13 month old) and hearing phenotype (normal hearing and hearing loss). (B) Latency-intensity curves for ABR wave I. (C) Interpeak latencies I-II, II-IV and I-IV in response to 70 dB SPL click. Significant differences were determined using ANOVA test, *p<0.05 (Slc7a8−/− versus Slc7a8+/+ mice). (D) Amplitude-intensity curves for ABR wave I. (E) Amplitudes of ABR wave I, II and IV. Significant differences were determined using ANOVA test, #p<0.05 (hearing loss Slc7a8−/− vs normal hearing Slc7a8+/−mice).
Figure 1—figure supplement 5. Hearing phenotype of C57BL/6J Slc7a8 knockout mice.

Figure 1—figure supplement 5.

(A, B) Auditory Brainstem Response (ABR) thresholds in response to click stimuli in from wild type (Slc7a8+/+, white, n = 18), heterozygous (Slc7a8+/−, green, n = 5) and knockout (Slc7a8−/−, blue, n = 15) mice, grouped by age (1–3, 4–6 and 7–13 month-old) and expressed as mean ±standard error (A), individual value (scatter plot, B) and median (boxplot, B). The significance of the differences was evaluated using ANOVA test, *p<0.05 (Slc7a8−/−, vs Slc7a8+/+). (C) Auditory Brainstem Response (ABR) thresholds in response to click stimuli in from wild type (Slc7a8+/+, white, n = 18) and knockout (Slc7a8−/−, blue, n = 15) mice at 2-, 3-, 4- and 5-month life. (D) Pie chart showing the percentage of mice showing normal hearing (all thresholds < 45 dB SPL, white), mild hearing loss (at least two tone burst threshold >45 dB SPL, orange) and severe (at least two tone burst threshold >60 dB SPL, red) hearing loss (HL), within each genotype and age group. (E) ABR thresholds in response to click and tone burst stimuli (8, 16, 24, 32 and 40 kHz) in mice from three genotypes separated by age group and hearing phenotype (normal hearing or hearing loss). Significant differences were determined using ANOVA test, **p<0.01, ***p<0.001 (hearing impaired Slc7a8−/− versus Slc7a8+/+).