
Figure 2. Immunolocalization of SLC7A8 in the mouse cochlea.
(A) Representative photomicrographs of cryosections of the base of the cochlea showing immunodetection for SLC7A8 (green) and s100 (red); and staining for DAPI (blue) or phalloidin (white) of wild type (upper row) and Slc7a8−/− mice (lower row). Scale bar, 100 µm. (B) On the left overlay image of a wild-type section indicating cochlea areas. Scale bar, 100 µm. On the right schematic drawing of the adult scala media adapted from Sanchez-Calderon et al. (2010). BC, border cells; CC, Claudius's cells; DC, Deiter's cells; HC, Hensen's cells; IC, intermediate cells; IHC, inner hair cells; IPC, inner phalangeal cells; Li, spiral limbus; MB, Basilar Membrane; OHC, outer hair cells; PC, pillar cells; RM, Reisner's membrane; SG, spiral ganglion; SL, spiral ligament; SV, stria vascularis; TM, tectorial membrane. (C) Quantification of SLC7A8 expression. Intensity of SLC7A8 immunofluorescence was normalized per mm2. Mean ±SEM from quadruplicates for each section, taken from apex, middle and basal cochlear turns of 4 wild-type (black), 3 Slc7a8+/− (green) and 4 Slc7a8−/− (blue) young (4- to 7-month-old) mice. Open and closed circles represent individual mice from C57BL6/J-129Sv or C57BL6/J backgrounds, respectevely. Unpaired Student’s t-test statistical analysis, p-values: *,≤0.05; **,≤0.01 and ***,≤0.001. (D) Quantification of SLC7A8 protein expression in the apex, middle and basal cochlear turns normalized per nuclei of young (2 month-old) (open bars) and old (12 month-old) (black bars) wild-type CBA mice. Data (mean ±SEM) were obtained from four cochlear sections obtained from three mice per group. Unpaired Student’s t-test statistical analysis, p-value: *,≤0.05.

Figure 2—figure supplement 1. Quantification of transcripts in the Slc7a8−/− mouse cochlea.
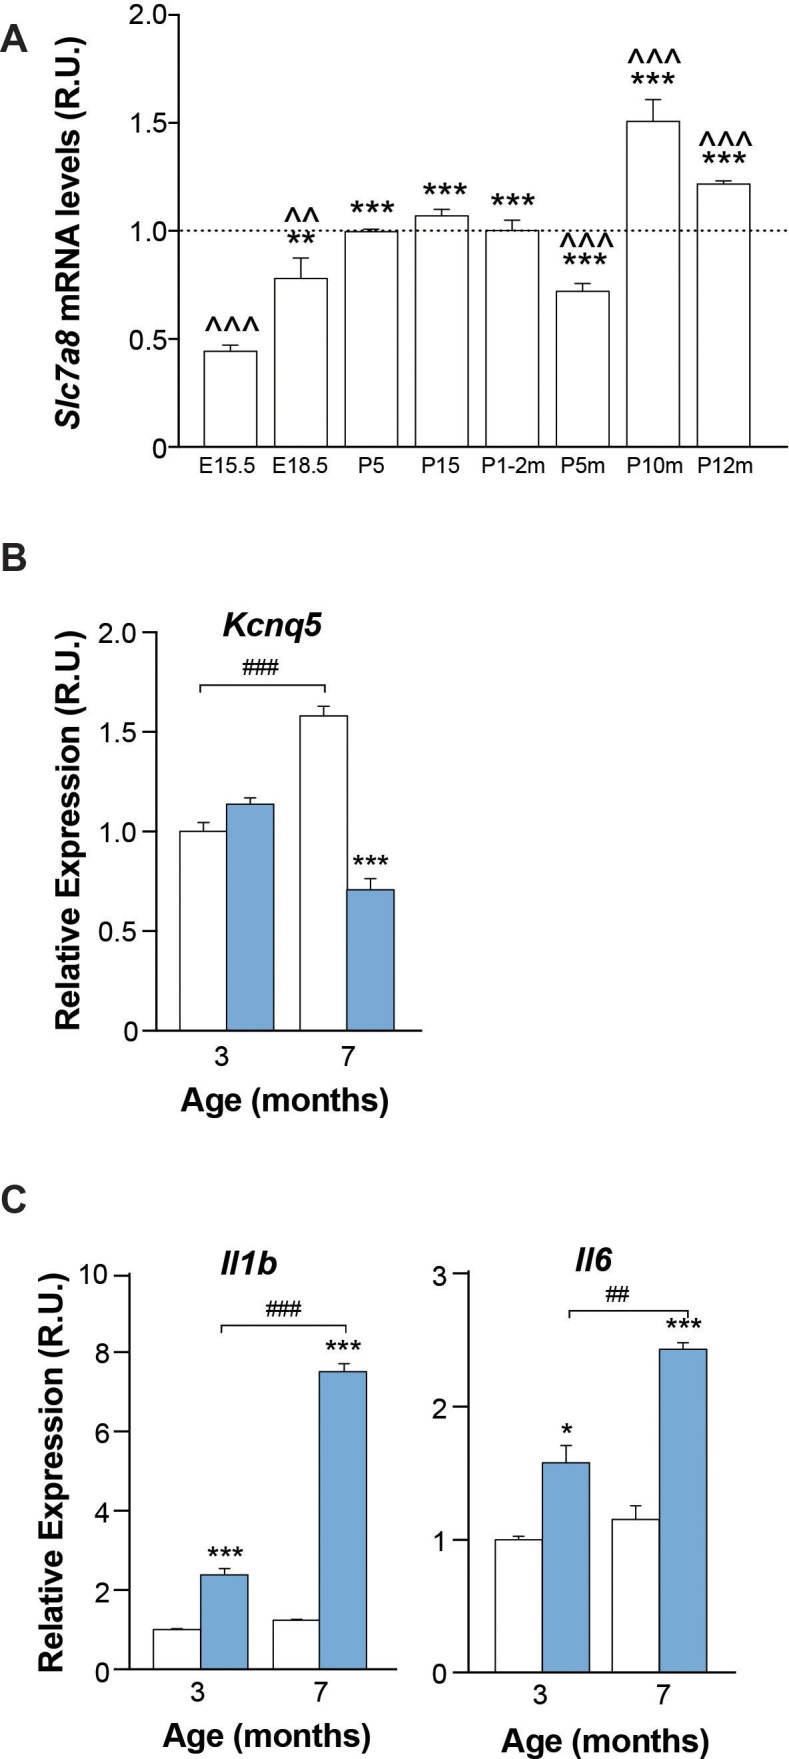
Figure 2—figure supplement 2. Progression of hearing phenotype of C57BL/6J Slc7a8 knockout mice.
