


Figure 2.
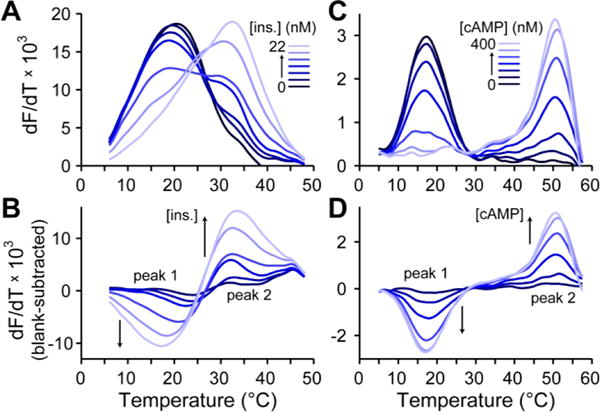
Representative data from insulin and cAMP TFA. (A) dF/dT curves with antibody-oligo probes show melting transitions that shift and change intensity in proportion to insulin levels. (B) Blank-subtracted dF/dT curves show clear insulin-dependent changes and allow removal of background interferences. (C) dF/dT curves with DNA-binding protein and oligo probes exhibit melting transitions that are cAMP-dependent. (D) Similar, blank-subtracted curves for cAMP quantification.