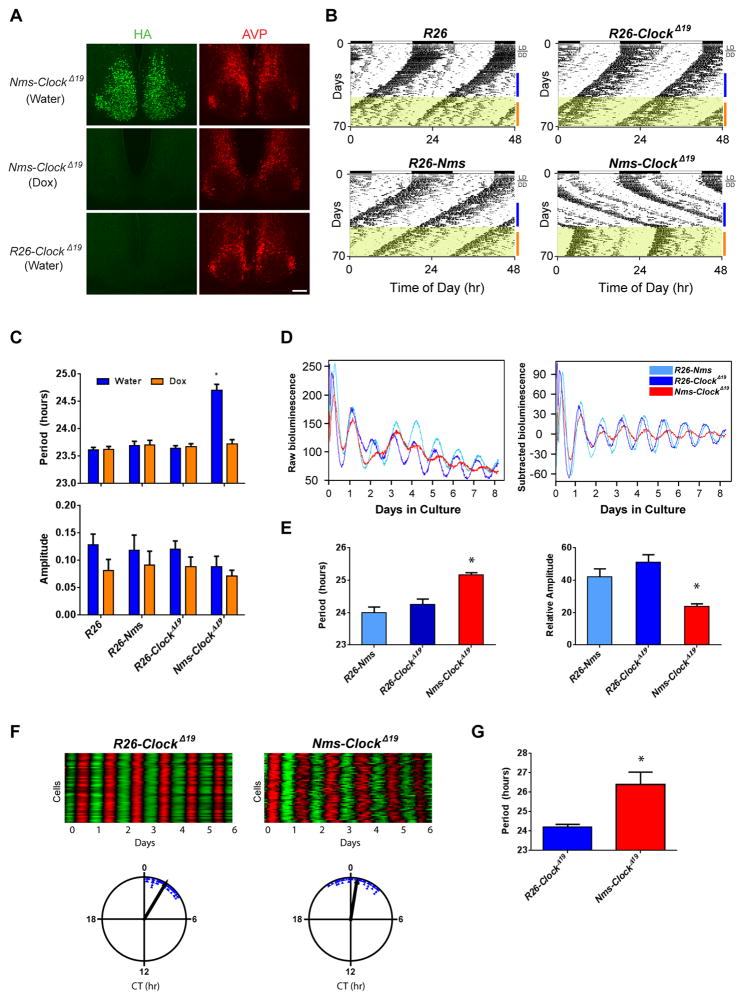
Figure 2. Reversible Overexpression of ClockΔ19 in Nms Neurons Lengthens Circadian Period.
(A) Immunostaining of HA (green) on SCN sections of Nms-ClockΔ19 mice administered with water (top), 1 week of Dox (middle), and R26-ClockΔ19 mice given water (bottom). Immunostaining of AVP peptide (red) was performed as a staining control. The scale bar represents 100 μm.
(B) Representative actograms of Nms-ClockΔ19 transgenic (bottom-right) and genetic controls (R26: top-left; R26-ClockΔ19: top-right; R26-Nms: bottom-left). All mice were initially placed in 12:12 LD for at least 7 days then transferred into DD, as indicated on the plot. Dox (10 μg/ml) water was administered during the intervals highlighted in yellow. Colored bars to the right of the actograms represent the days of analyses presented in (C).
(C) Quantification of circadian activity in Nms-ClockΔ19 transgenic and genetic controls. A significantly longer freerunning period was observed in water-treated Nms-ClockΔ19 mice compared to all other groups (two-way ANOVA, *p< 0.05 by Tukey’s post-hoc test). Mean freerunning amplitude was not different among water- or Dox-treated mice across all genotypes (two-way ANOVA, p>0.05 by Tukey’s post-hoc test). Values are means ± SEM (R26, n=6; R26-Nms, n=6; R26-ClockΔ19, n=12; Nms-ClockΔ19, n=7).
(D) Representative PER2::LUC bioluminescence records from the SCN of Nms-ClockΔ19;Luc mice and controls. Raw and baseline-subtracted plots are both displayed (R26-Nms: light blue trace; R26-ClockΔ19: dark-blue trace; Nms-ClockΔ19: red trace).
(E) Quantification of average SCN period and amplitude in Nms-ClockΔ19 and control mice. Nms-ClockΔ19 SCN exhibit longer mean circadian period and lower circadian amplitude compared to R26-Nms and R26-ClockΔ19 SCN (one-way ANOVA, *p< 0.05 by Tukey’s post-hoc test). Values are means ± SEM (R26-Nms, n=9; R26-ClockΔ19, n=7; Nms-ClockΔ19, n=8).
(F) Representative heatmap and Rayleigh plots of PER2::LUC oscillation in 50 neurons from the SCN of adult R26-ClockΔ19 and Nms-ClockΔ19 mice. In the heatmap, the red corresponds to peak bioluminescence and the green to trough. The length of the arrow in the Rayleigh plot represents the strength of synchronization.
(G) Quantification of average circadian period of individual SCN neurons from R26-ClockΔ19 and Nms-ClockΔ19 mice (Student’s t test, *p<0.0001). Values are as means ± SD (R26-ClockΔ19, n=50; Nms-ClockΔ19, n=50).

