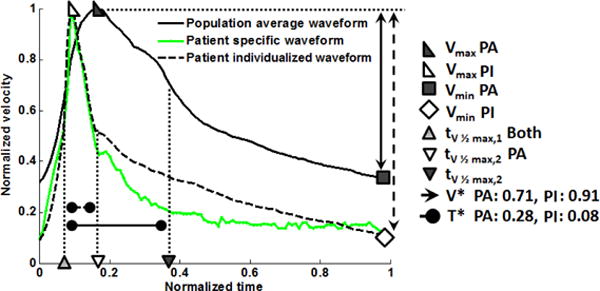
Fig. 12.

Example of morphing the population averaged velocity waveform to obtain a waveform with prescribed values of (V*,T*). Shown are the morphed normalized velocity waveform compared with the older population averaged waveform and the patient specific waveform. Only the values of (V*,T*) were prescribed to match the morphed and patient waveform. In the legend: PA = Population averaged; PM = individualized.
