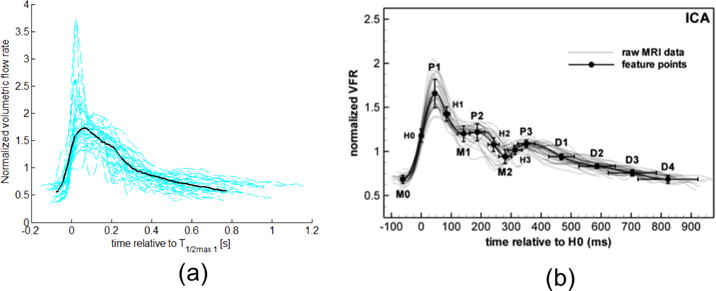
Fig. 3.

Normalized velocity waveforms (dashed lines) and mean waveform (solid line) for (a) representative subset of older population from this study, and (b) healthy, young adults, reproduced from [5] with permission of IOP Publishing. All rights reserved. Only a subset of the 272 waveforms from aged adults and the corresponding average are shown in (a) to avoid crowding the figure. The volumetric flow rate was calculated by assuming Poiseuille flow, and therefore, the normalization in (a) and (b) are equivalent, though it should be noted these axis are scaled differently. Collective patient waveforms in both (a) and (b) are aligned by the point of mid-acceleration V1/2 max, denoted as H0 in (b).
