
FIGURE 5.
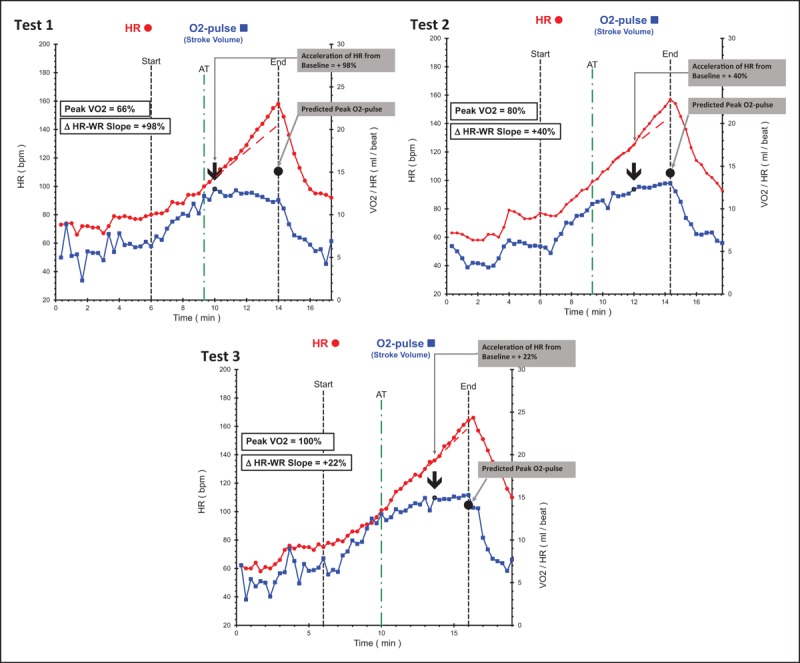
Serial comparison data of an individual acting as his own control; cardiovascular risk factors included a strong family history, hyperlipidemia and sedentary lifestyle. Test 1: baseline study at age 36 without symptoms demonstrating pronounced cardiac dysfunction with low peak volume of oxygen metabolized during exercise. Note the pronounced drop in stroke volume response just after the anaerobic threshold resulting significantly reduced peak O2-pulse. Heart-rate–work-rate response accelerates concurrently with 98% increase in slope from baseline. Test 2: repeat study after 3.3 years of medical therapy with statin + niacin with no change in lifestyle. Lipids improved dramatically and repeat cardiopulmonary exercise testing demonstrates less cardiac dysfunction with improved stroke volume response resulting in 12% higher peak volume of oxygen metabolized during exercise (ml/kg/min) and peak O2-pulse (ml/min) with less acceleration of heart-rate–work-rate slope (compensatory response has diminished). Test 3: motivated by improvement in Test 2, this person started regular exercise with cross-fit regimen. Test 3 is 4.5 years after Test 2 and represents effect of exercise in addition to continuing lipid therapy. Absolute peak volume of oxygen metabolized during exercise increased 30%, peak O2-pulse increased 15% and there is borderline left ventricular dysfunction with marginal acceleration of heart-rate response after the anaerobic threshold. This individual has better cardiovascular function at age 42 than he did at 36 and has likely improved his long-term prognosis, quality of life, and healthcare costs. ΔHR–WR slope, change in heart-rate slope in last 2 min of exercise compared with heart-rate slope at anaerobic threshold; AT, anaerobic threshold; bpm, beats per minute; HR, heart rate; O2-pulse, oxygen pulse (volume of oxygen metabolized during exercise/heart rate); SV, stroke volume.