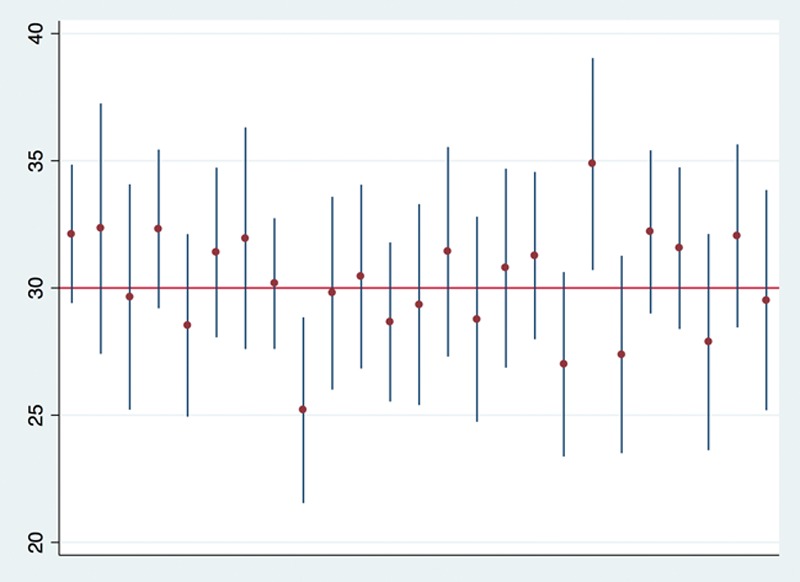
Figure 1.

Ninety-five percent confidence intervals (vertical lines) and means (dots) calculated from a simulation of 25 samples (sample size of 30 each) drawn from a normally distributed population with a mean of 30 and a standard deviation of 10. One could think of this as a population of patients with a mean age of 30 y and a standard deviation of 10 y, from which we sample n = 30 patients to estimate the mean age in the population, and we repeat this experiment 25 times. Note that 23 of the confidence intervals (23/25 = 92%) cover the “true” population mean of 30. If we (infinitely) keep repeating this simulation, we would expect that 95% of the confidence intervals contain the true population parameter value.
