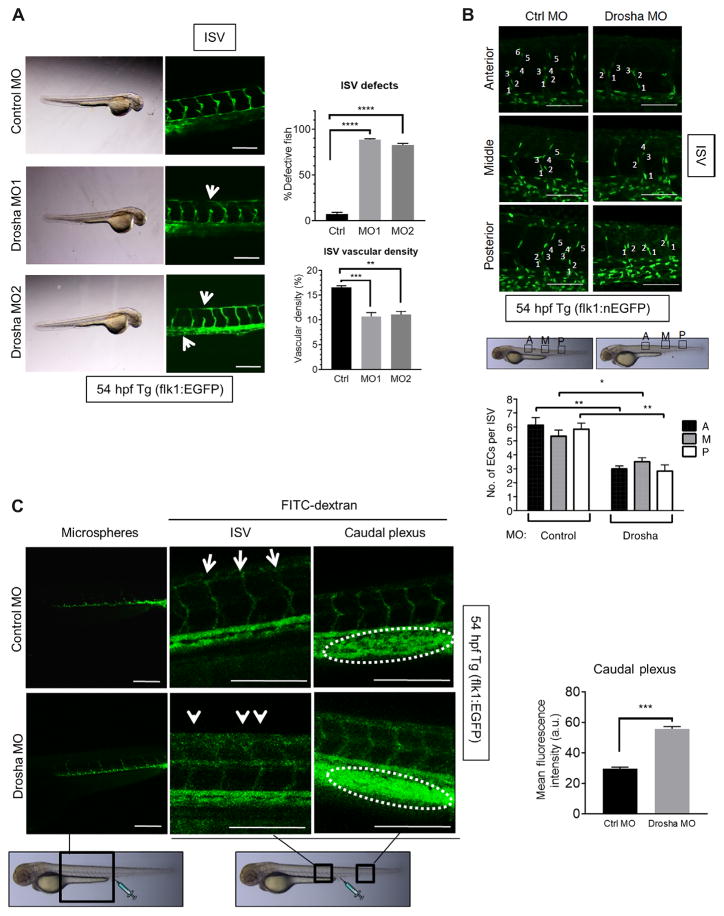
Fig. 1. Drosha morphants exhibit vascular abnormalities with increased vascular permeability.
(A) Two different Drosha morpholino oligonucleotides (MO) (MO1 or MO2) or control MO (Ctrl) were injected into Tg(flk1:egfp)s843; Tg(gata1:dsRed)sd2 zebrafish at the one- to two-cell stage. Representative images of intersegmental vessel (ISV) are shown. n = 33 zebrafish for Ctrl MO, 34 zebrafish for MO1, and 35 zebrafish MO2. The fraction (%) of fish with defective ISVs and vascular density are shown as means ± SEM. White arrow, defective ISVs. **P < 0.01, ***P < 0.001, ****P < 0.0001, significant by one-way analysis of variance (ANOVA) with post hoc Tukey’s test. (B and C) Ctrl MO (2 ng) or Drosha MO (1 ng of MO1 + 1 ng of MO2) was injected into Tg(fli1:nEGFP)y7 (B) or Tg(flk1:egfp)s843 (C) zebrafish at the one- to two-cell stage. (B) Representative images of the anterior (A), middle (M), or posterior (P) regions of the ISVs. The number of endothelial cells (ECs) per ISV was shown as means ± SEM. n = 33 zebrafish for Ctrl MO and 28 zebrafish for Drosha MO. (C) Representative angiography images of ISVs and the caudal plexus are shown. Mean fluorescence density of the caudal plexus is presented as means ± SEM. n = 18 zebrafish for Ctrl MO and 20 for Drosha MO. a.u., arbitrary units. *P < 0.05, **P < 0.01, ***P < 0.001, significant by two-tailed unpaired Student’s t test. Scale bars (A to C), 200 μm.

