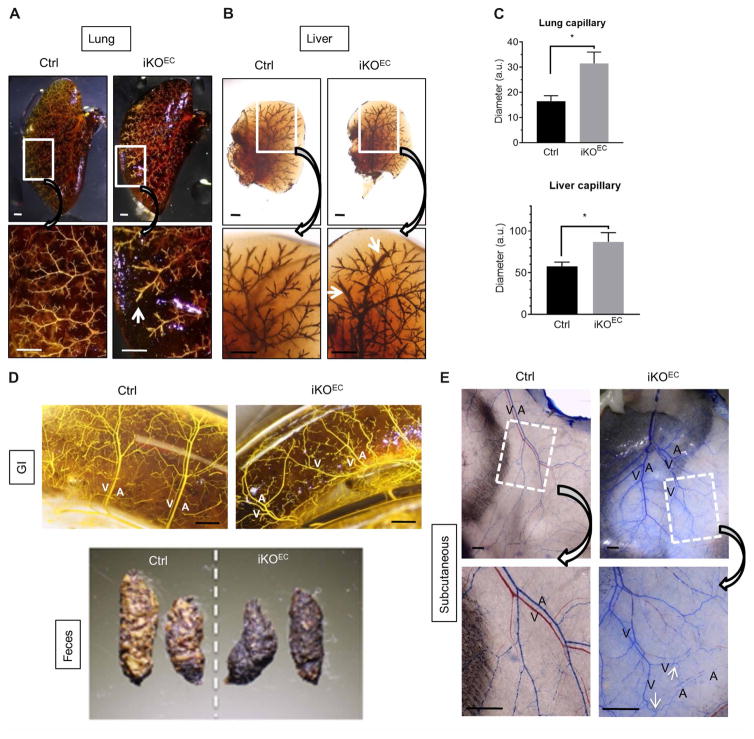
Fig. 3. Postnatal depletion of Drosha in the endothelium in mice results in HHT-like vascular abnormalities.
(A) Representative images of lungs from 10-week-old Drosha iKOEC or Ctrl mice. White arrow, dilated capillary. n = 4 mice for each genotype. Scale bar, 1 mm. (B) Representative images of livers from 8-month-old Drosha iKOEC or Ctrl mice. White arrow, dilated capillary. Scale bar, 1 mm. n = 3 mice for each genotype. (C) The diameter of lung and liver capillaries was quantified by ImageJ and presented as means ± SEM. *P < 0.05, significant by two-tailed unpaired Student’s t test. (D) Representative images of intestines from 8-month-old Drosha iKOEC or Ctrl mice and feces from 13-month-old Drosha iKOEC or Ctrl mice. A, artery; V, vein. n = 4 Ctrl and 3 iKOEC mice. Scale bar, 1 mm. (E) Representative images of the subcutaneous vasculature in the back of 8-month-old Drosha iKOEC and Ctrl mouse n = 4 mice for each genotype. Scale bar, 500 μm.

