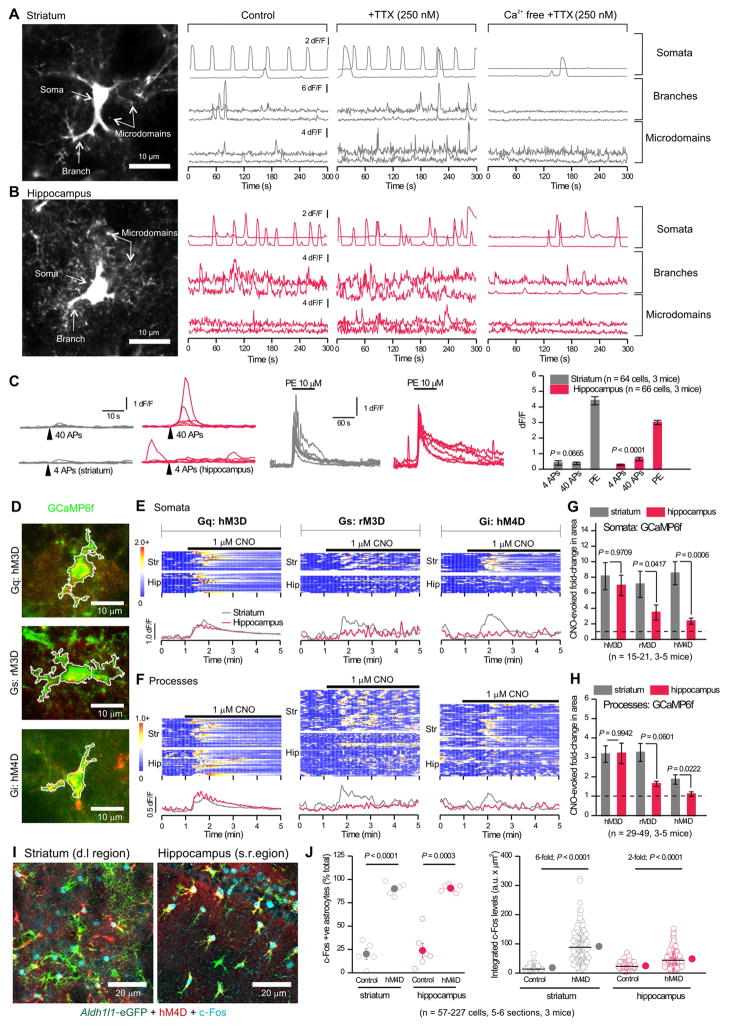
Figure 2. Properties of Ca2+ signals in striatal and hippocampal astrocytes.
A–B. Left: Projections of GCaMP6f expressing d.l. striatal (A) and hippocampal CA1 s.r. (B) astrocytes; arrows indicate compartments with Ca2+ signals. Right: Representative traces of GCaMP6f dF/F for control, in 0.25 μM TTX, and in Ca2+ free extracellular buffers with TTX (Supp Fig 2). C. EFS of cortical input to the d.l. striatum and EFS of Schaffer-collaterals in the hippocampus CA1 s.r. evoked similar, but modest Ca2+ signals. Phenylephrine (PE) evoked large Ca2+ elevations. D. Example images of astrocytes co-expressing GCaMP6f (green) and each of the three mCherry-tagged DREADDs (red). E. Top: Kymographs of astrocyte somatic Ca2+ signals (GCaMP6f dF/F) upon activation of DREADDs with 1 μM CNO. Each row represents a single cell. Below: Average traces from d.l. striatal (grey) and hippocampal CA1 s.r. (red) astrocytes (n = 15–21 cells from 3–5 mice). F. As in E, but for astrocyte process Ca2+ signals. G & H. Average CNO-evoked fold-change in area under the curve for astrocyte somata (G) and processes (H). I. Representative images show hM4D (red) expressing astrocytes (green) with increased levels of c-Fos (cyan) 1 hr after 1 mg/kg CNO. J. The % of c-Fos positive astrocytes and the integrated c-Fos intensity. Raw data are shown with open circles; closed circles indicate the mean ± s.e.m. The median is shown with a line. Data were collected from 5–6 sections from 3 mice.

