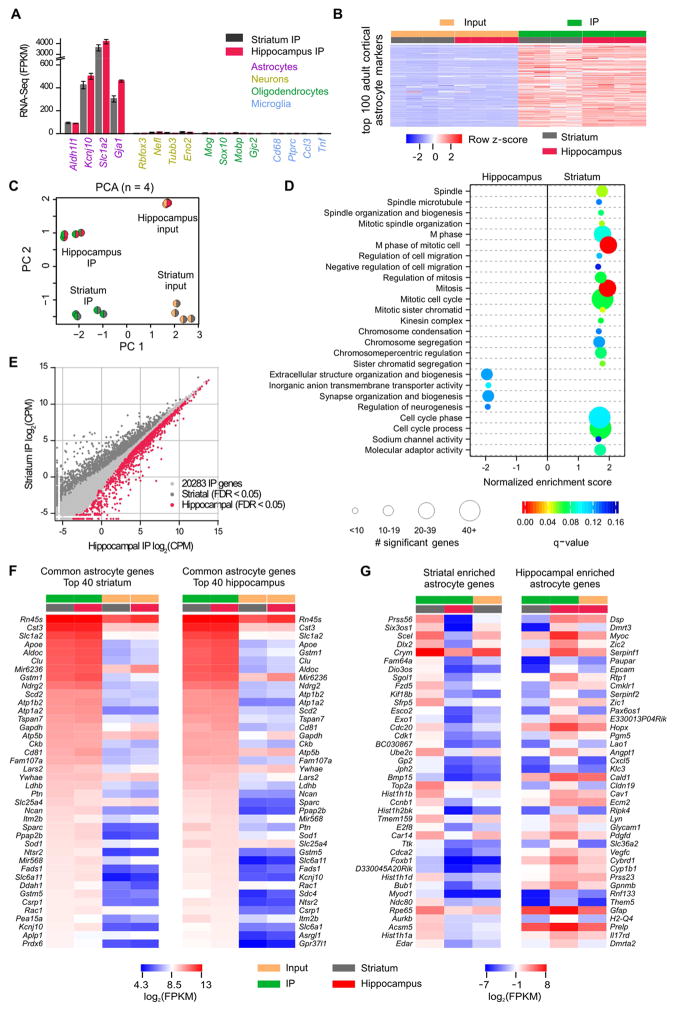
Figure 4. Comparison of adult striatal and hippocampal astrocyte transcriptomes.
A. Gene expression levels (in fragments per kilobase per million; FPKM) of markers for astrocytes, neurons, oligodendrocytes, and microglia in IP samples (n = 4). B. Heatmap representing 16 RNA-Seq samples from 4 mice showing relative enrichment (red) or depletion (blue) of the top 100 adult cortical astrocyte markers. Row z-scores were calculated using FPKM. C. Striatal and hippocampal astrocyte principal component analysis of the 2000 most variable genes across 16 samples. D. Gene Set Enrichment Analysis with all genes sequenced in striatal and hippocampal IP sample (threshold q-value < 0.15) identified 21 gene sets enriched in striatal astrocytes and 4 gene sets enriched in hippocampal astrocytes. The size of the circle corresponds to the number of significant genes whereas the color indicates the significance of the regional enrichment based on normalized enrichment score (NES). E. Differential expression analysis comparing striatal and hippocampal IP samples identified 1180 striatal and 1638 hippocampal enriched astrocyte genes (threshold FDR < 0.05, Supp Excel file 1). F. FPKM heatmaps of the top 40 astrocyte genes that were not differentially expressed between regions as ranked by IP FPKM value. Log2(FPKM) ranged from 4.3 (blue, relatively low expression) to 13 (red, relatively high expression). G. FPKM heatmaps of the 40 most differentially expressed astrocyte genes between striatal and hippocampal astrocytes as ranked by differential expression LimmaVoom log ratio (FPKM > 0.1). The most highly expressed striatal astrocyte gene is Crym, and the most highly expressed hippocampal astrocyte gene is Gfap. Log2(FPKM) ranged from −7 (blue, relatively low expression) to 8 (red, relatively high expression).

