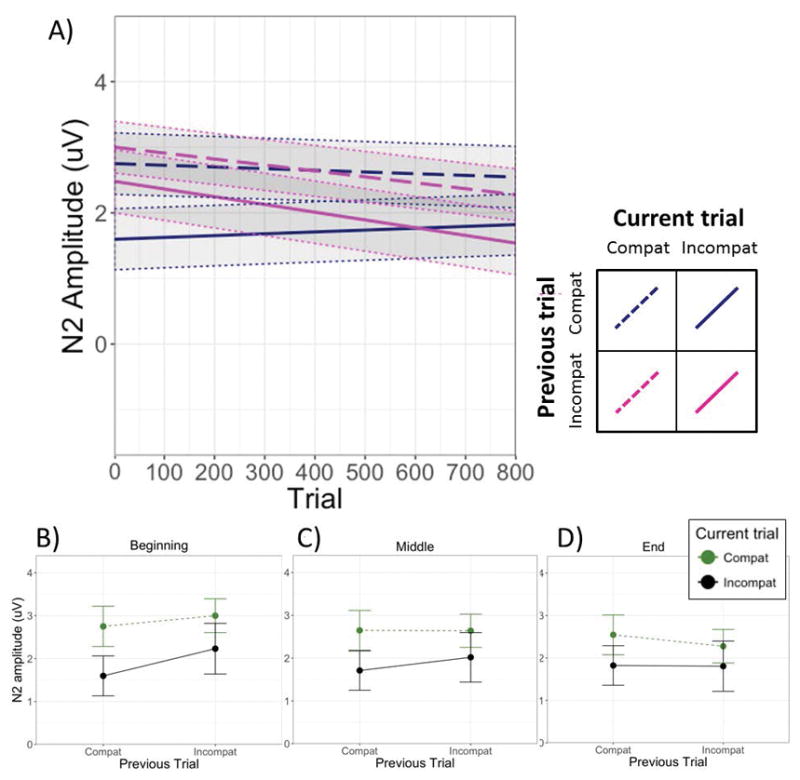
Figure 3.

Panel A depicts the change in N2 amplitudes as a function of condition over the course of the experiment. The solid and dashed lines represent the simple slopes for the four sequential trial combinations of interest, estimated from the model corresponding to Table 1. Panels B, C, and D represent estimated (model-derived) means and standard errors for each condition at the beginning, middle, and end of the task, each estimated using a separate model with the Trial variable centered on the first trial, mean trial, and last trial, respectively.
