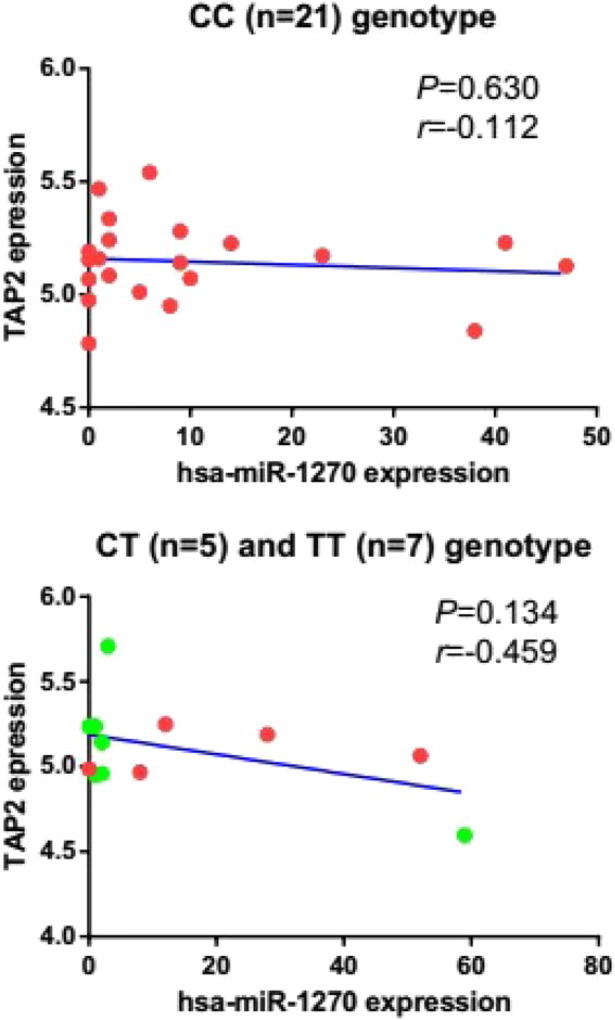
Fig. 2.
Correlation between the expression of CC and CT/TT genotypes of TAP2 and hsa-miR-1270 expression. The expression levels of (A) CC (n = 21) genotype (r = −0.112, P = 0.630) and (B) CT (n = 5)/TT (n = 7) genotype (r = −0.459, P = 0.134) of TAP2 were not statistically significantly correlated with hsa-miR-1270 expression levels in the dataset of GSE49280 using Pearson’s correlation analysis.

