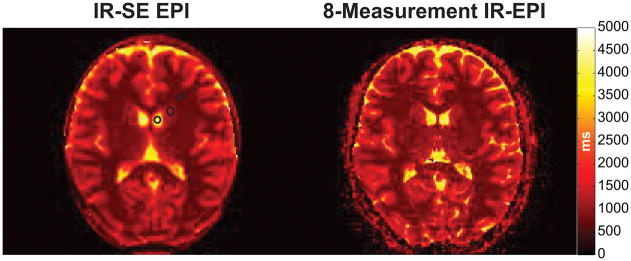
Fig. 9.
In vivo T1 map from a single slice estimated with the recommended IR-SE sequence in comparison to the T1 map obtained with the 8-measurement optimized protocol for the same slice. The black circles indicate the locations of the grey matter, white matter and CSF regions used to compare the agreement between the two methods.

