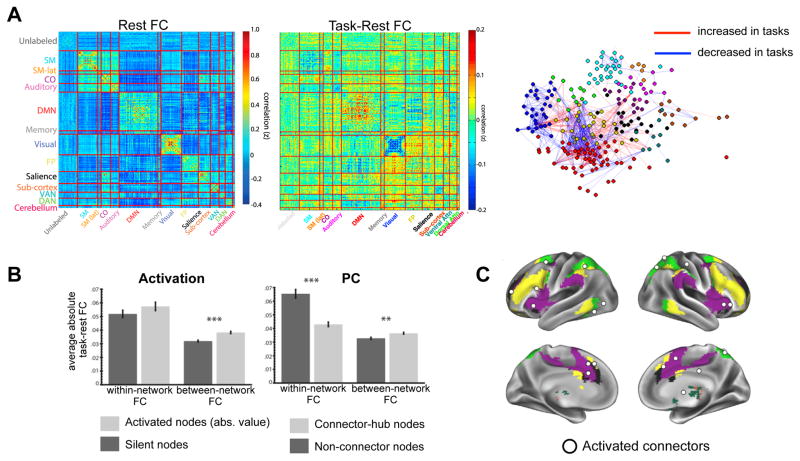
Figure 3. Network organization is systematically altered in different task contexts, especially for activated regions and hubs.
(A) Network organization at rest is shown in the form of a correlation matrix (left). At rest, network organization is dominated by high-correlations within each network (on diagonal), and low correlations between different networks (off-diagonal). During tasks, FC changes systematically both within and between networks, as shown in both the difference correlation matrix (center) and spring embedded plot (right). Especially prominent changes are seen within processing networks (visual, somatomotor, and DMN), between control and processing networks (e.g., FP to visual), and among control networks (e.g., FP to DAN and CO/Salience).
(B, Left) Task-activated regions had high changes in functional connectivity during tasks, especially between networks (B, Right) Connector hubs showed more fine-tuned modulations during tasks – like activated regions, connector hubs showed highly altered functional connectivity between networks, but additionally showed relatively stable within network functional connectivity.
(C) Regions that were both activated and connector hubs (“activated connectors”; shown as white spheres) had a constellation of attributes that tightly linked them to task-control, including their localization primarily to control-networks of the brain (color underlay; yellow = FP, purple = CO, green = DAN, black = salience).
These figures were modified from Gratton et al. (2016).

