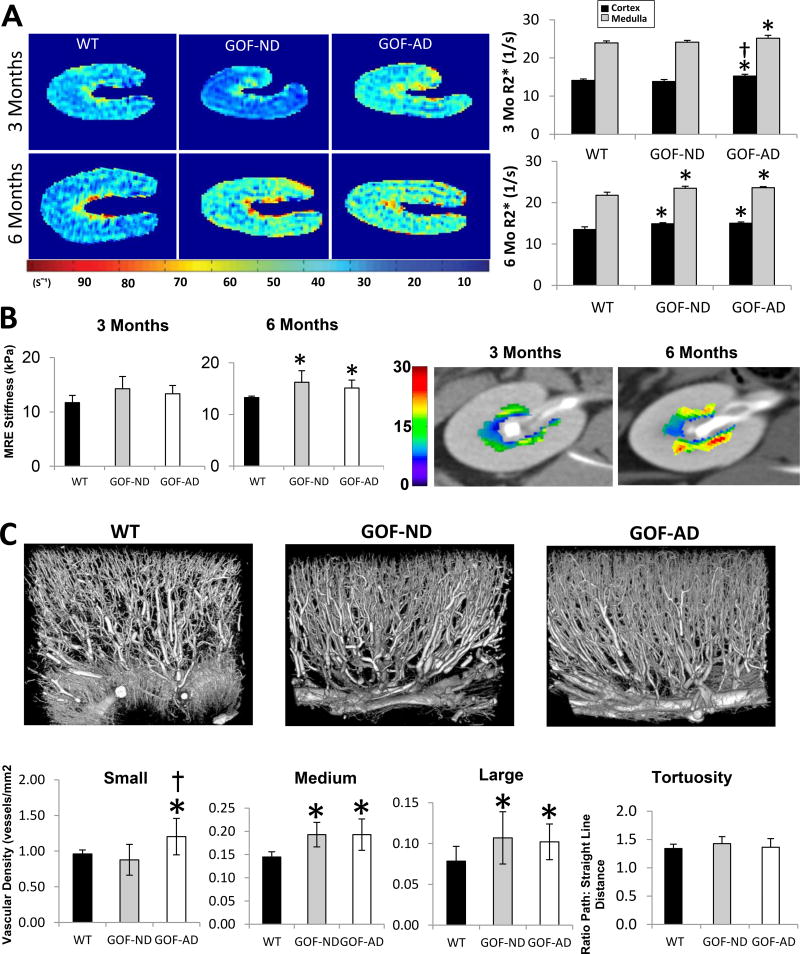
Figure 2.
(A) Single-kidney BOLD-MRI illustrating hypoxic regions (yellow-red). R2* in the cortex and medulla increased in GOF-AD by 3-months on diet, and in GOF-ND by 6 months (n=7/group). (B) MRE showed in-vivo elevated renal medullary stiffness (yellow-red) at 6-month in both GOF groups (n=5/group). (C) Representative three-dimensional micro-CT images of kidney segments and quantification of renal microvascular spatial density and tortuosity, showing an increase in the microvascular density in GOF groups unchanged tortuosity. *p<0.05 vs. WT; †p<0.05 vs. GOF-ND.

