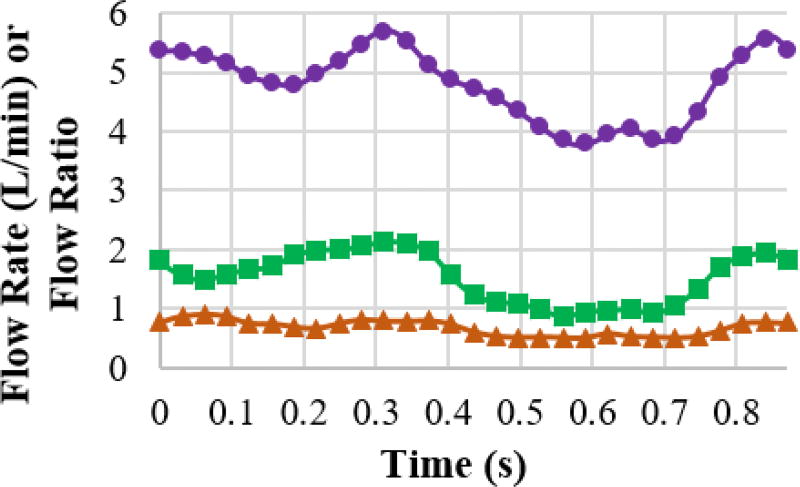
Figure 2.
The comparison of the flow rate and flow ratio between clinical measurement (markers) and the corresponding values from simulation (corresponding solid lines) for a representative case. Purple circular marker: IVC flow rate; Green rectangular marker: SVC flow rate; Orange triangular marker: flow ratio of LPA over RPA.

