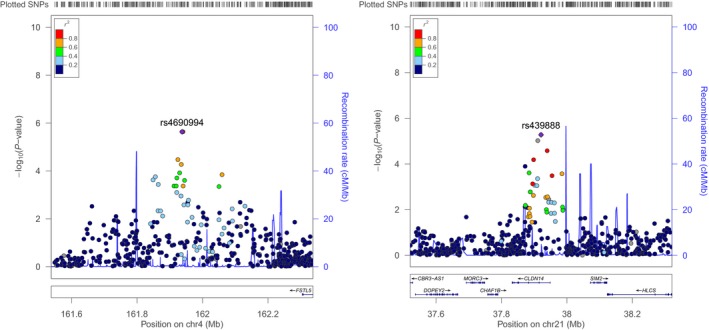
Figure 1.

Regional association plots of the top two loci that emerged with the strongest evidence of association (lowest P‐values, even though not genome‐wide significant) with ECC among the 212 preschool‐age children participating in the ZOE genome‐wide association study, left panel (a): 4q32 locus (lead SNP: rs4690994, P = 2.3 × 10⁻⁶; odds ratio (OR) = 3.5; 95% confidence interval (CI) = 2.1–5.9); right panel (b): the 20q22 locus (lead SNP rs439888; P = 5.3 × 10⁻⁶; rs439888 intronic SNP; OR = 3.6; 95% CI = 2.1–6.2). Position on the x‐axis corresponds to genomic coordinates (position), and the position on the y‐axis corresponds to each SNP's –log10(P‐value). The top, or ‘lead’, SNP is coloured purple, whereas other polymorphisms are colour coded by their r 2, a measure of linkage disequilibrium, with the lead SNP. Plots were generated using Locus Zoom21.
