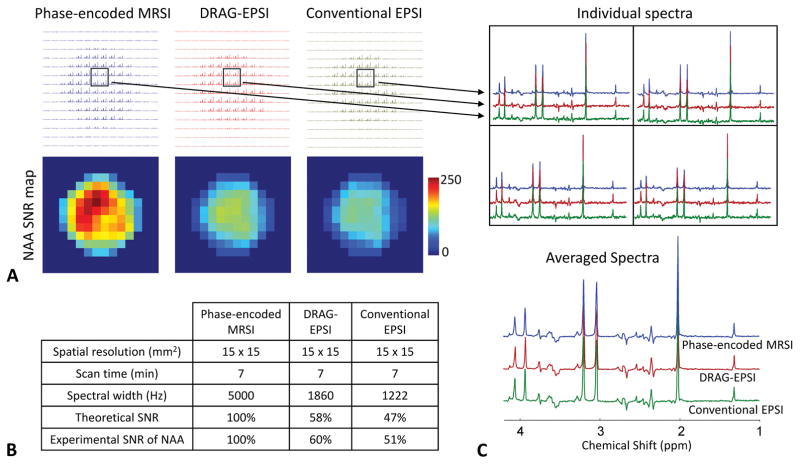
Figure 2.
Comparison between conventional phase-encoded MRSI (blue), DRAG-EPSI (red) and conventional EPSI (green) in a GE Braino phantom (10 cm diameter) at 7T with resolution of 15×15 mm2 (FOV = 210×210 mm2). Scan time was 7 minutes for each of the methods. Spectra were apodized with a 1 Hz exponential function. A) Layout of all spectra and NAA SNR maps for the three methods. C) SNR comparison between the three methods. Experimental SNR of NAA was 205, 124 and 104 for phase-encoded MRSI, DRAG-EPSI and conventional EPSI, respectively. C) Spectra of 4 voxels for each of the three methods and averaged spectra.

