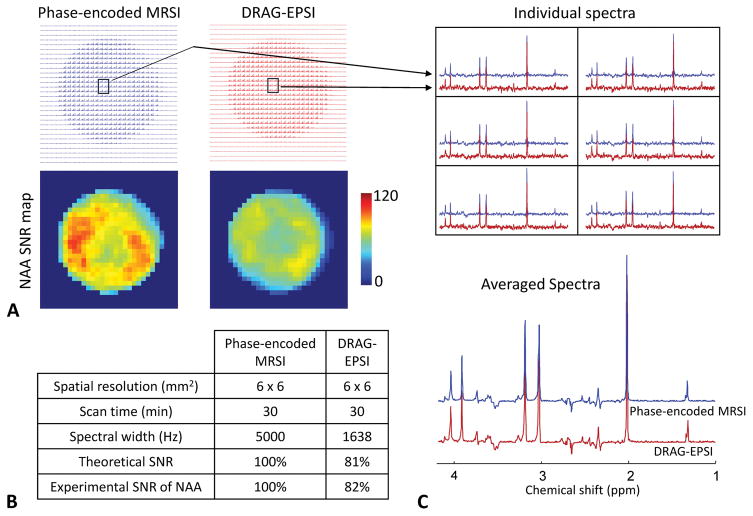
Figure 3.
Comparison between conventional phase-encoded MRSI (blue) and DRAG-EPSI (red) in a GE Braino phantom at 7T with resolution of 6×6 mm2 and FOV of 180×180 mm2. Scan time was 30 minutes for each method. The number of signal averages was 1 and 30 for conventional phase-encoded MRSI and DRAG-EPSI, respectively. Spectra were apodized with a 1 Hz exponential function. A) Layout of all spectra and NAA SNR maps for the two methods. B) SNR comparison between the two methods. Experimental SNR of NAA was 77 and 63 for phase-encoded MRSI and DRAG-EPSI, respectively. C) Spectra of 6 voxels for each of the two methods and averaged spectra.

