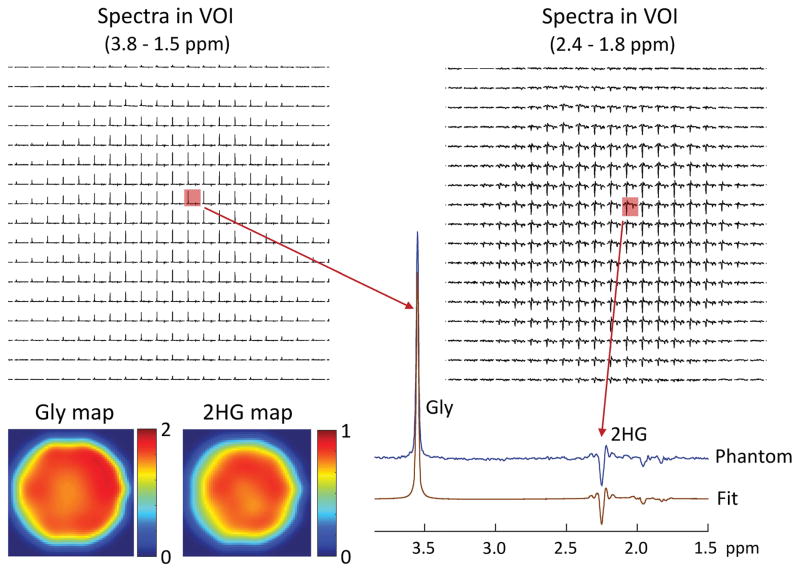
Figure 5.
In vitro validation of DRAG-EPSI at 7T, with VOI prescription by TE 78 ms PRESS (TE1 = 58 ms and TE2 = 20 ms), in a 6-cm diameter spherical phantom solution (pH = 7.2) with 2HG (10 mM) and Gly (20 mM). Spectra within VOI (in-plane resolution 6×6 mm2; slice thickness 14 mm) are shown for 3.8 - 1.5 ppm and 2.4 - 1.8 ppm. A spectrum from a voxel is magnified and shown together with the LCModel fit. The estimated concentration of 2HG and Gly are color coded into maps. The data were acquired at room temperature with TR = 6 s.

