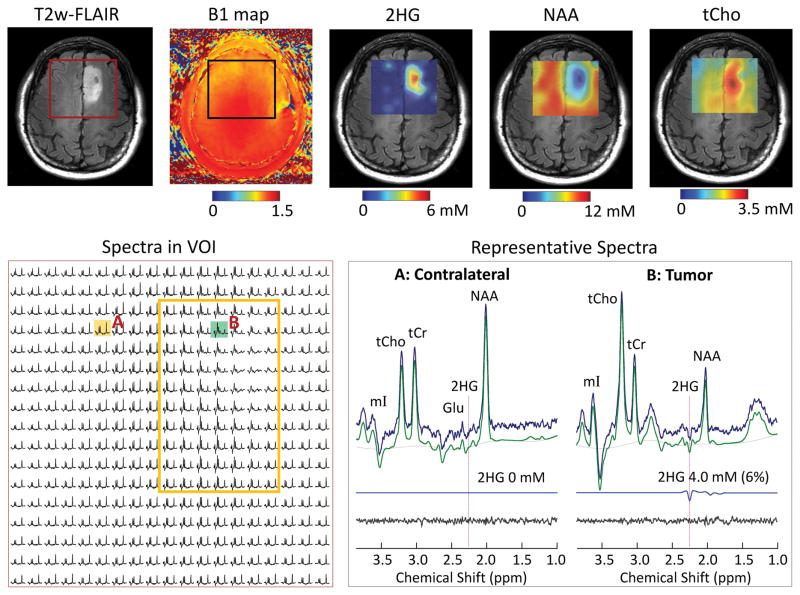
Figure 6.
In vivo DRAG-EPSI data from a patient with IDH1-mutated grade-II oligodendroglioma (Patient 1), obtained using TE 78 ms PRESS for VOI prescription at 7T. Shown in upper panel are VOI in T2w-FLAIR and B1 map, and maps of 2HG, NAA and tCho, which were generated with 5-fold bilinear interpolation using Matlab. In the lower panel, spectra within VOI are displayed for 1.8 – 3.85 ppm on the left, with a yellow box indicating the tumor. On the right, spectra in tumor (location B) and contralateral (location A) are shown together with LCModel fits, residuals and 2HG signals. The 2HG estimates are presented with CRLB values in brackets.

