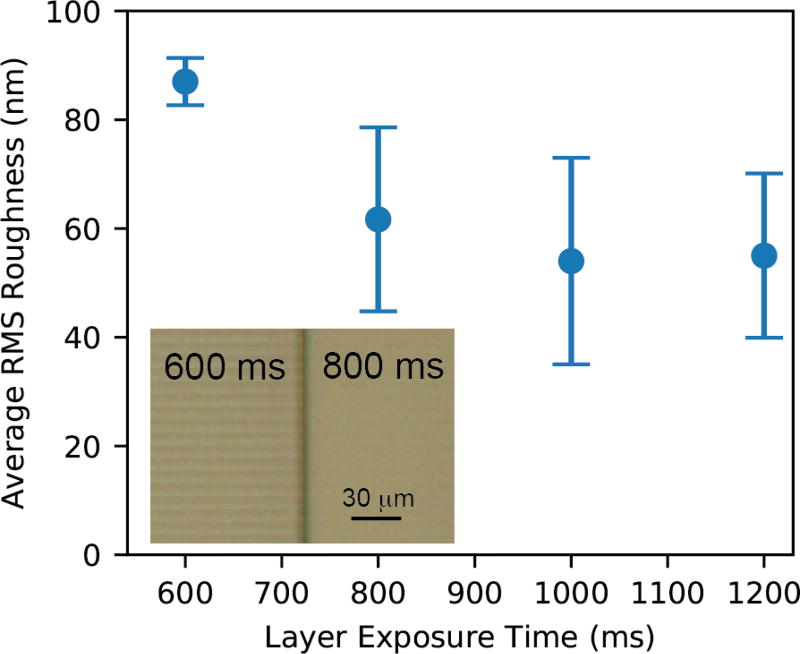
Fig. 3.
Measured average surface roughness as a function of layer exposure time. The error bars indicate the standard deviation of the three measurements for each exposure time that are described in Sect. 2.3. Inset: microscope photo of device with adjacent regions having 600 and 800 ms layer exposure times. Faint pixelation is more observable for the former than the latter.

