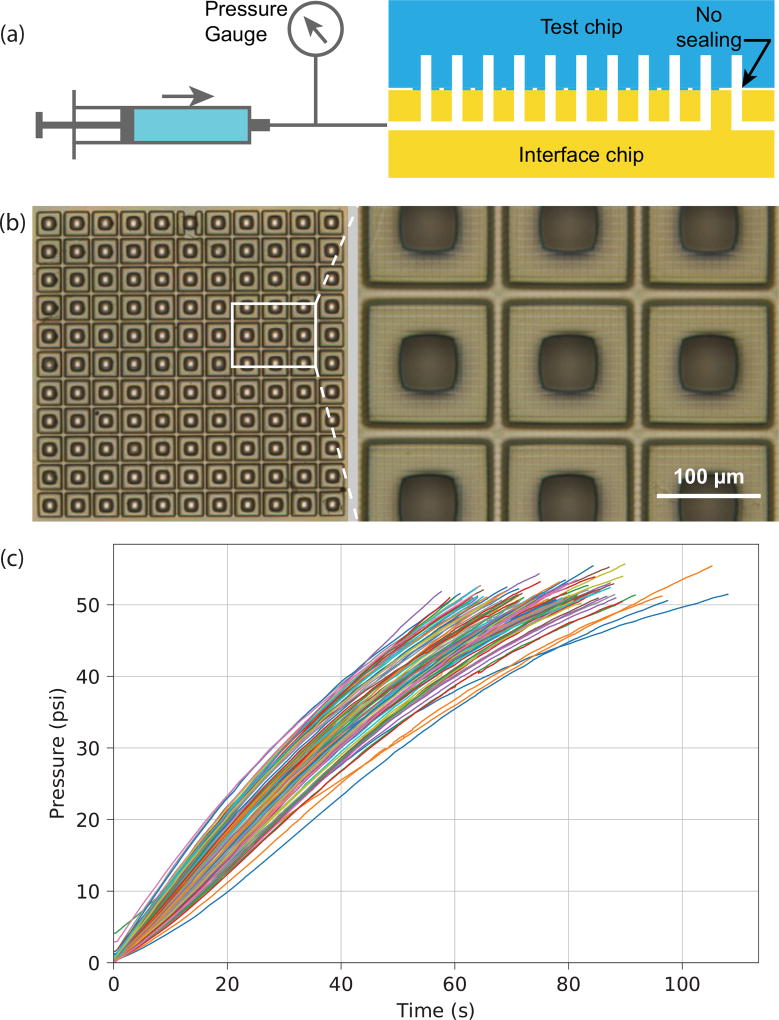
Fig. 5.
(a) 11 × 11 interconnect array test set up. (b) Composite image from four Zeta-20 microscope images of fabricated 11×11 array of SIMs. Close up shows details of SIMs, including slight pixelation of the sealing surface. (c) Pressure as a function of time for the test set up in (a) repeated 100 times.

