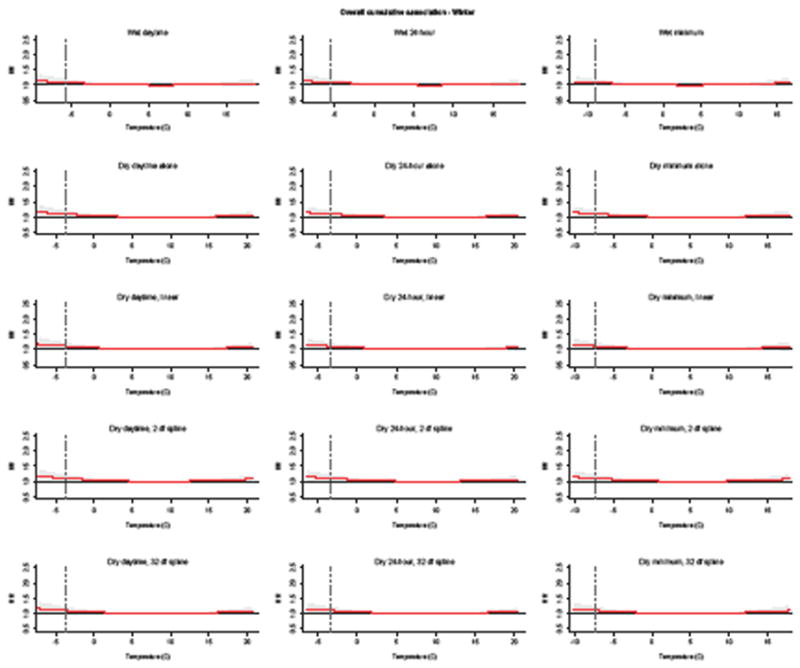
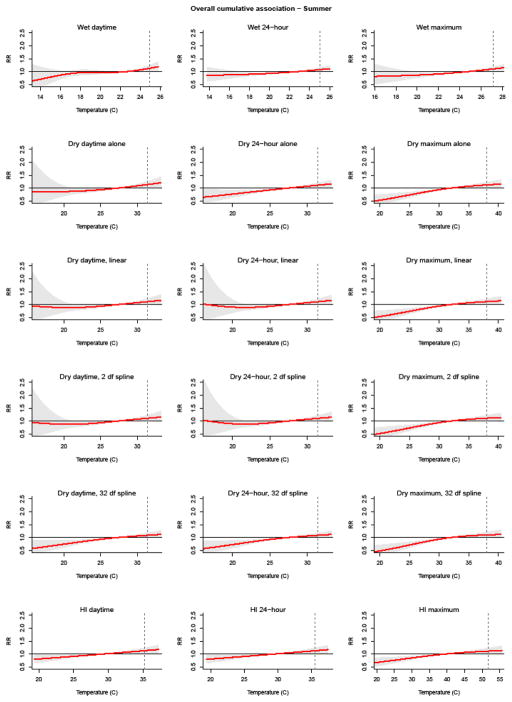
Figure 3.

Cumulative relative risk of kidney stone presentations associated with different temperature metrics and humidity adjustment, relative to the 50th percentile for each season.
The number and placement of spline knots were selected using quasi-AIC for each model in A) summer and B) winter. Shaded areas denote the 95% confidence intervals. Vertical dashed line:1st and 99th percentile of each temperature metric in winter and summer periods, respectively.

