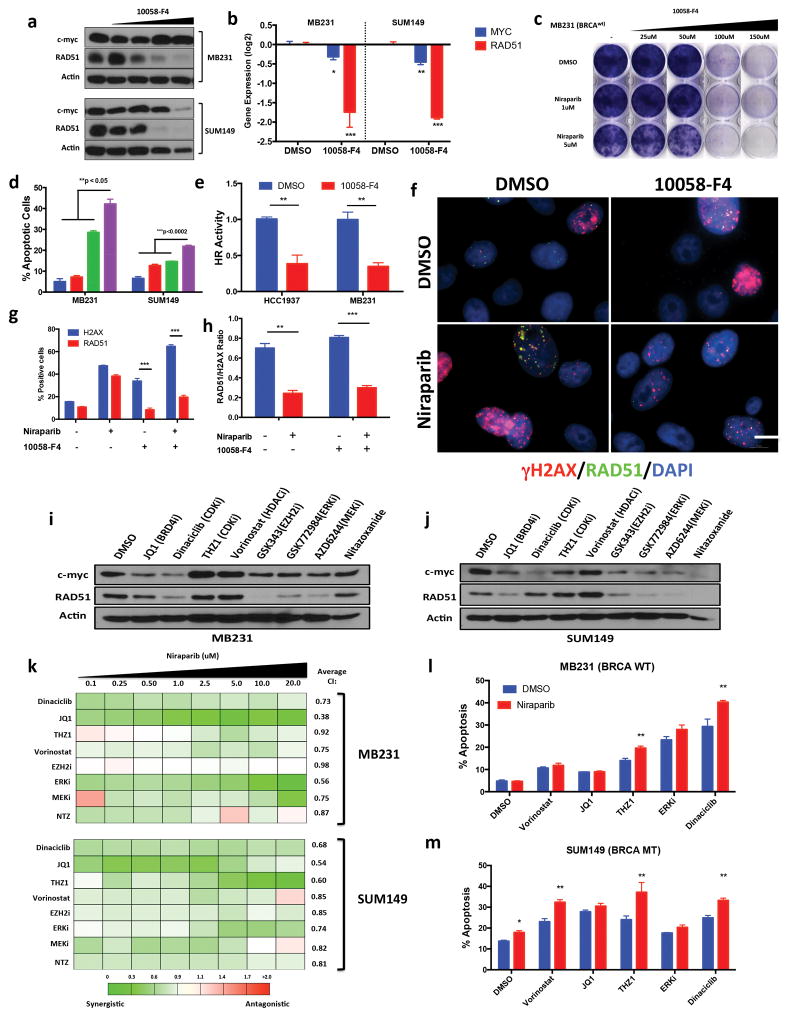
Figure 3.
Inhibition of MYC in TNBC induces PARP inhibitor sensitivity (a) Immunoblot analysis for c-myc, RAD51, Actin (ctrl) of MB231 & SUM149 cells treated with DMSO, MYC inhibitor 10058-F4 25–150μM 72hr (b) RT-PCR analysis of c-myc, RAD51 in cells treated with 10058-F4, MB231 (100μM) SUM149 (50μM). Values are normalized to the levels of actin RNA expression in control (DMSO) cells (n = 3). Statistical analysis via unpaired two-sided t-test (c) Clonogenic assay: MB231 cells treated 72hr with DMSO (ctrl) 10058-F4 (25–150μM) and Niraparib (1, 5mM) with 9 day release (d) Annexin V and propidium iodide staining of cells treated 72hr with 10058-F4 (MB231: 100μM, SUM149: 50uM), Niraparib 1μM followed by drug release. Error bars represent mean ± s.d. (n ≥ 3 independent experiments). (e) DR-GFP homologous recombination repair assay. MB231 & HCC1937 cells treated with 10058-F4 72hr, followed by transfection of DR-GFP & analyzed by FACS. Values are normalized with those from control group. Error bars represent mean ± s.d. (n ≥ 3 independent experiments). (f–h) Immunofluorescence analysis of MB231 cells treated 72hr with DMSO (ctrl), 10058-F4 (100μM), Niraparib (5mM) (f) Immunofluorescence images of γH2AX (red), RAD51 (green), nuclear DAPI (blue). Scale bar, 10μm. Representative images of three independent experiments. (g–h) Quantification of γH2AX, RAD51 staining. Representative images of three different experiments. Data are mean ± s.d. of biological replicates. (i–j) Immunoblot analysis for c-myc, RAD51 and Actin of (i) MB231 & (j) SUM149 cells treated 72hr with DMSO, JQ1 (1μm), Dinaciclib (25nM), THZ1 (50nM), Vorinostat (2.5μM ), GSK343 (10μM), GSK772983 (1μM), AZD6244 (10μM) Nitazoxanide (10μM) (k) Synergistic analysis of MB231 & SUM149 cells treated with Niraparib (0.1–20μM) in combination with the panel of drugs from i–j. 72hr HTSA was performed and synergism was determined using Calcusyn (<0.9 = synergism, 0.9–1.1 = Additive, >1.1 + Antagonistic) (l–m) Annexin V and propidium iodide staining of cells treated 72hr with Niraparib 1uM, in combination with panel of drugs followed by 72 drug release. Error bars represent mean ± s.d. (n ≥ 3 independent experiments). *P < 0.05, **P < 0.01 two-way ANOVA with Sidak post-test correcting for multiple comparisons.

