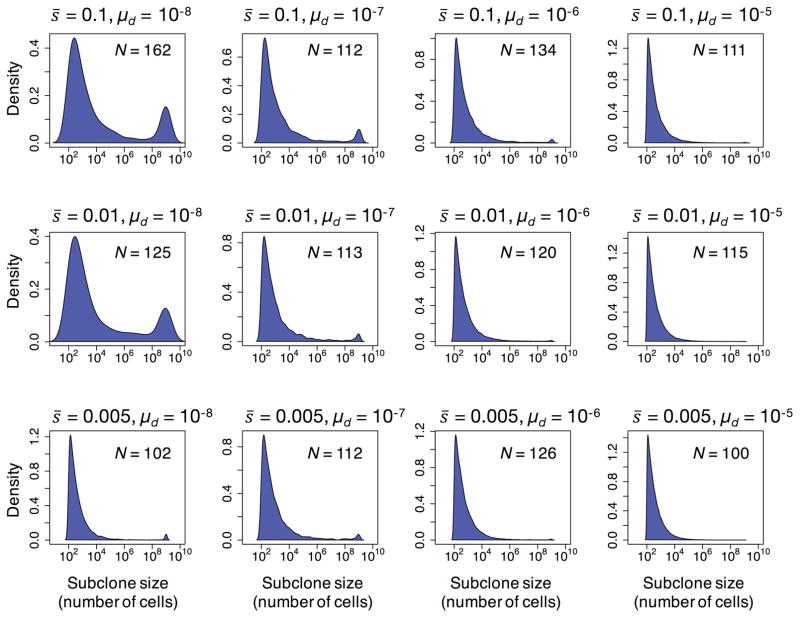
Figure 3.
Probability density function for the log10 sizes of subclones carrying driver mutations present in the clinically detectable simulated tumors for each combination of parameter values; N is the number of clinically detectable tumors generated by the model. The distribution has a heavy right tail with only a few dominant clones present at ≥10% frequency, composing most of the tumor cell population (Fig. 2A), and with the majority of subclones present at frequencies below the detection limit of standard sequencing techniques.

