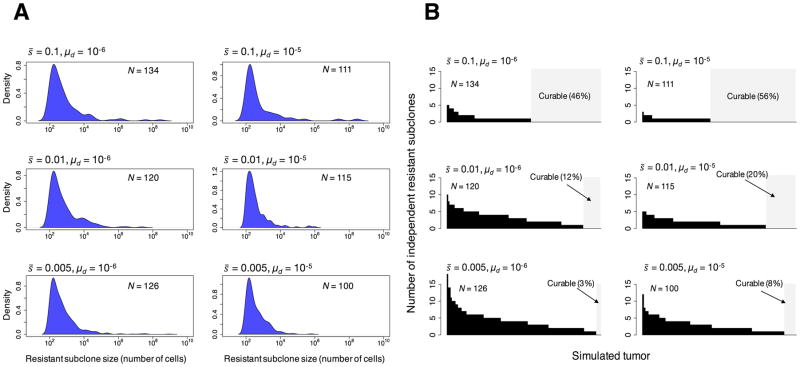
Figure 5.
Resistant subclones in clinically detectable simulated tumors. (A) Probability density functions for the log10 sizes of therapeutically resistant subclones within in the primary simulated tumors. (B) Number of independent resistant subclones in each simulated primary tumor. Each bar represents a tumor. The area in light gray represents those simulated tumors with no resistant subclones, which should be curable. For each set of parameter values used, N is the number of tumors generated by the model. It is assumed that a resistant mutation occurs at a rate of 1 × 10⁻⁸ per cell division. Resistant mutations are assumed not to affect fitness.

