
Figure 2.
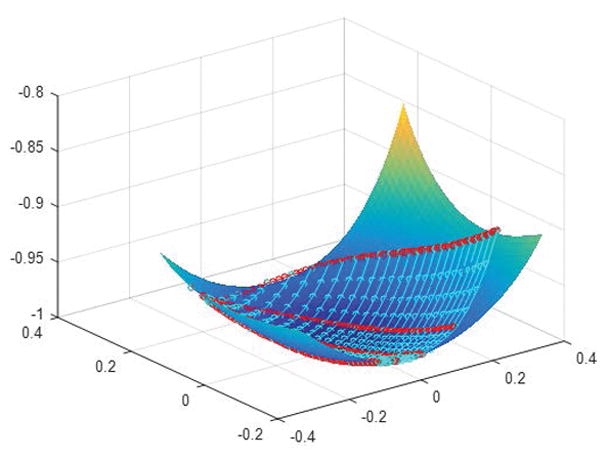
Visualization of the projected 3D randomized SVD space of the coarse MRF-FISP dictionary, fitted with a degree 5 polynomial. The 3 axes are the 3 singular vectors used for approximation. Each cyan curve represents a unique T1 value and each red curve represents a unique T2 value. The cyan and red circles represent the fitted values along different T1 and T2 curves, partitioning evenly each T1, T2 coarse level segment into 4 parts.