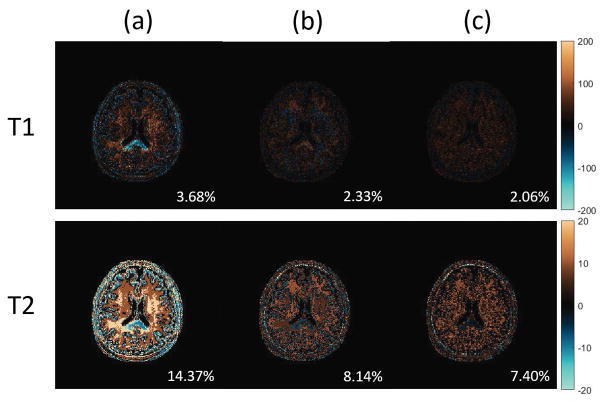
Figure 7.
T1, T2 difference maps of a brain data between different MRF-FISP dictionaries. First row: T1 map differences. Second row: T2 map differences. Column (a): difference maps between the coarse dictionary and the fine dictionary. Column (b): difference maps between the piecewise linear interpolated coarse dictionary and the fine dictionary. Column (c): difference maps between the polynomial fitted coarse dictionary and the fine dictionary. Note the scaling factor changes in both T1 and T2 cases.

