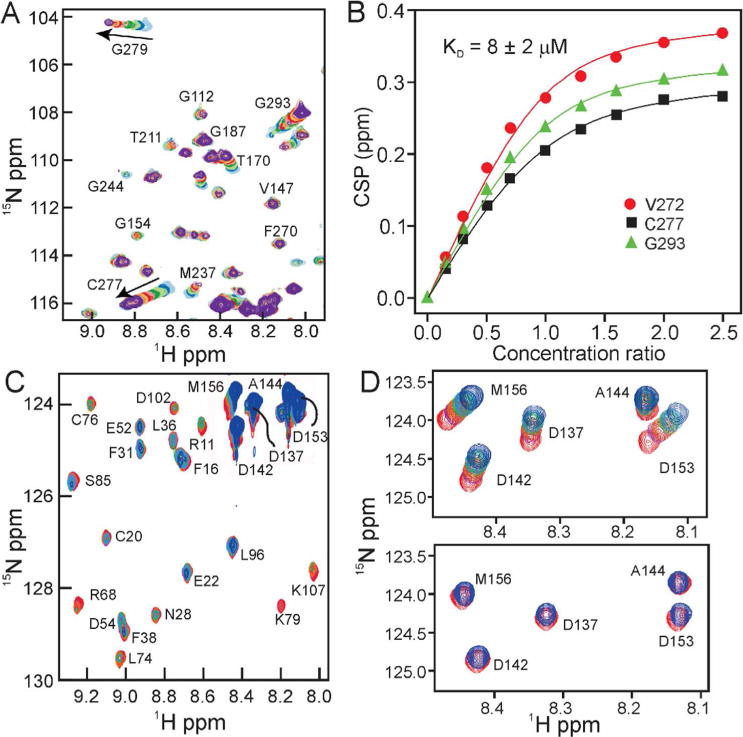
Figure 2.

A. Portion of a series of 1H-15N HSQC spectra of 15N-labeled p53(88-312) with increasing mole ratios of p23(1-160). p53:p23 ratios: light blue – 1.0:0.0; dark blue – 1.0:0.17; light green – 1.0:0.3; dark green – 1.0:0.5; pink – 1.0:0.7; red – 1.0:1.0; gold – 1.0:1.3; orange – 1.0:1.6; light purple – 1.0:2.0; purple – 1.0:2.5. The sample is in 25 mM Tris, pH 7.0, 50 mM NaCl, 5 mM DTT, 298K. B. Plots of p53 chemical shift perturbation (CSP) as a function of added p23 for three shifted residues. Solid lines are calculated using the equation shown in Materials and Methods. C. Portion of a series of 1H-15N HSQC spectra of 15N-labeled p23(1-160) with increasing mole ratios of p53(88-312). p23:p53 ratios: red – 1.0:0.0; purple – 1.0:0.5; orange – 1.0:1.0; green – 1.0:1.5; light blue: 1.0:2.0; dark blue: 1.0:2.5. D. Part of the series shown in part C plotted at higher contour level (upper) in 25 mM Tris, pH 7.0, 50 mM NaCl, 5 mM DTT, 298K and (lower) in 25 mM Tris, pH 7.0, 150 mM NaCl, 5 mM DTT, 298K.
