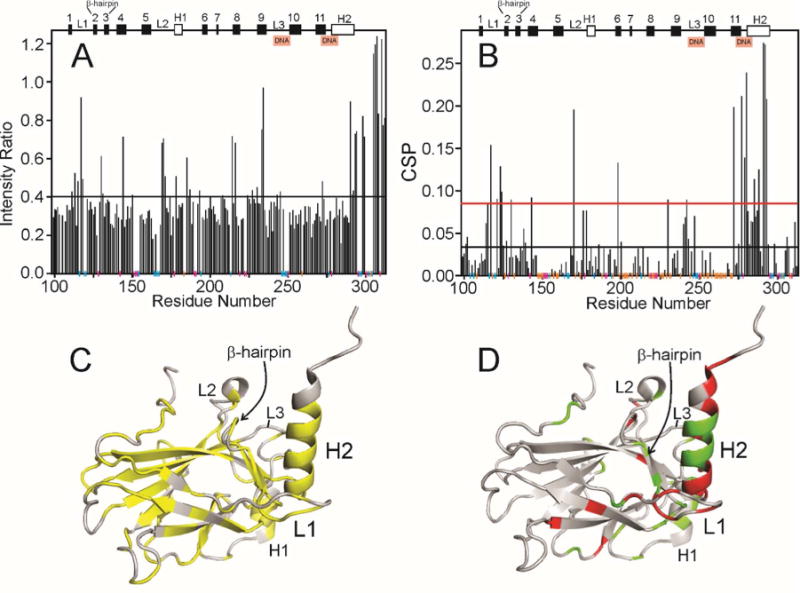
Figure 4.

Effect of addition of p23(1-160) to p53 DBD. A. Ratio of the intensity of cross peaks in the 1H-15N HSQC spectrum of 15N-labeled p53(88-312) free (light blue spectrum in Figure 2A) and in the presence of a 1:1 molar ratio of p23(1-160) (red spectrum in Figure 2A). Secondary structure elements are shown at the top of the figure (h indicates helix, otherwise β-strand) and the DNA-binding sites are indicated. Vertical colored lines along the horizontal axis indicate the presence of proline residues (magenta), residues for which cross peaks are not seen or are overlapped in the spectrum of free p53 (blue) and residues for which cross peaks are visible in the free spectrum but not in the 1:1 spectrum (true zero intensity ratio) (orange). The horizontal black line indicates the mean intensity ratio calculated including the orange points but not the blue or red points. B. Chemical shift perturbation of cross peaks in the 1H-15N HSQC spectrum of 15N-labeled p53(88-312) between the free protein (light blue spectrum in Figure 2A) and in the presence of a 1:1 molar ratio of p23(1-160) (red spectrum in Figure 2A) calculated using the formula . Vertical colored lines along the horizontal axis are the same as for Figure 4A. The horizontal black and red lines indicate the mean CSP and the standard deviation above the mean, respectively, calculated including the orange points but not the blue or red points. C. Backbone representation of the structure of p53 DBD (2FEJ4), colored yellow where the intensity ratio shown in Figure 4A lies below the mean value. D. Backbone representation of the structure of p53 DBD (2FEJ4), colored red where the CSP is greater than the mean + standard deviation (above the red line in Figure 4B) and green where mean < value < mean + standard deviation.
