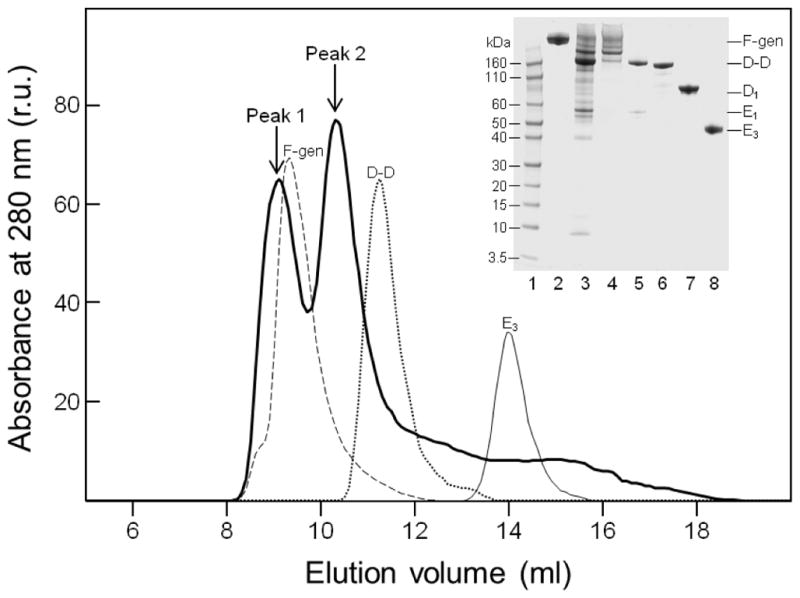
Fig. 1.

Size-exclusion chromatography and SDS-PAGE analysis of fibrin(ogen) degradation products. Solid thick line shows elution profile of the early plasmin digest of crosslinked fibrin on a Superdex-200 column; elution profiles of fibrinogen (broken line), D-D dimer (dotted line), and E3 fragment (thin line) are shown for comparison. Inset shows SDS-PAGE analysis of the early plasmin digest of crosslinked fibrin (lane 3) and peak 1 and peak 2 fractions (lanes 4 and 5, respectively); the D-D dimer, D1 fragment, and E3 fragment are in lanes 6, 7, and 8, respectively. Novex Sharp Prestained protein markers of the indicated molecular mass and freshly purified fibrinogen are in lanes 1 and 2, respectively.
