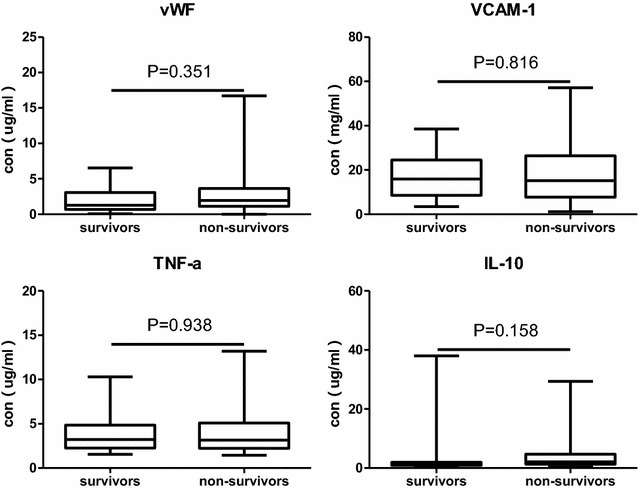
Fig. 5.

Comparison of plasma vWF, VCAM-1, IL10, TNFα concentration between survival group and death group in ARDSp patients. The concentration unit of vWF, IL10, TNFα is ug/ml. The concentration unit of VCAM-1 is mg/ml. Box plots are displayed where the horizontal bar represents the median, the box represents the IQR and the whiskers represent the maximum and minimum values. Comparisons made by Mann–Whitney U test
