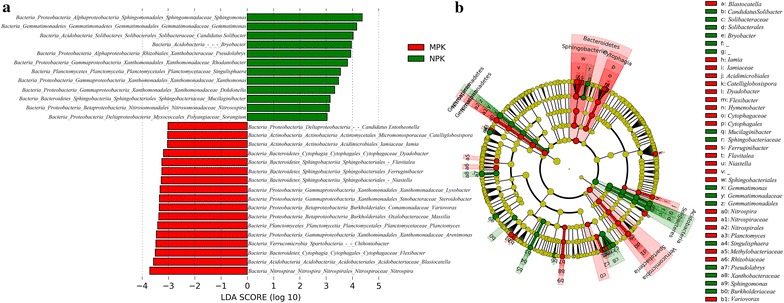
Fig. 3.

Bacterial taxa with significantly different abundances between NPK and MPK treatments. a Histogram of LDA scores for features with significantly different abundance between NPK and MPK treatments. b Taxonomic representation of statistically and biologically consistent differences between NPK and MPK treatments
