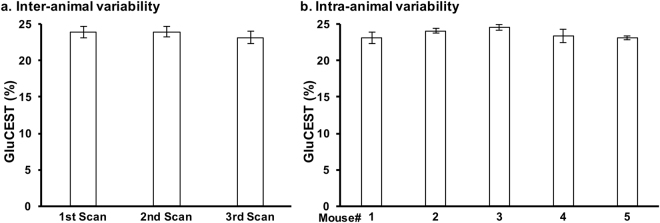
Figure 1.
Inter- and intra-animal variability of the GluCEST MRI. Five mice were scanned at three timepoints, with second and third scan at 3rd and 6th day following the first scan. The GluCEST values were calculated from ROIs placed in the striatum of the brain on the MR slice. (a) Average of GluCEST contrast from the striatum of the 5 mice from each scan and (b) Average of GluCEST contrast from 3 scans in each mouse. Data are presented as Mean ± SD.

