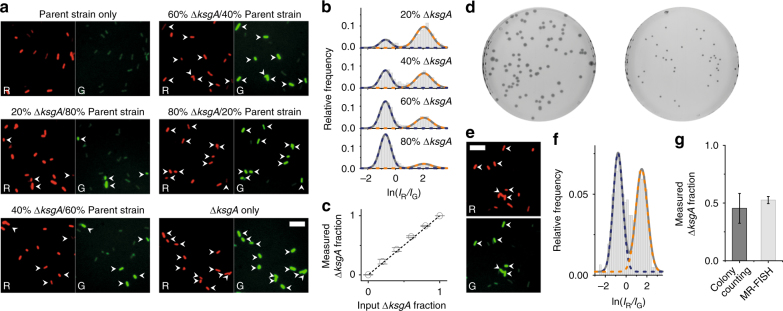
Fig. 3.
Detecting heterogeneity in mixtures of bacteria with different rRNA methylation status. a False-colored red and green fluorescence images of pure samples and mixtures of parent strain and ΔksgA E. coli after MR-FISH. All red images are shown at one fixed brightness and contrast, and all green images at another fixed brightness and contrast. To guide the eye, manually selected bacteria with high green fluorescence intensity are indicated with arrows in both red and green images. Scale bar: 10 μm. b Histograms of two-color ratios obtained from mixtures of parent strain and ΔksgA bacteria (n = 1372, 1639, 1593 and 1183 cells respectively for 20%, 40%, 60% and 80% ΔksgA). The data are fitted to a bimodal Gaussian distribution with centers and widths defined by fits of MR-FISH data from pure samples of each bacterium. c Quantification of the fraction of ΔksgA E. coli in mixtures with parent strain bacteria, based on the areas of each population extracted from the bimodal distributions of two-color ratios. The means and standard deviations of three technical replicates are plotted, while the equation of the dotted line is “measured fraction=input fraction”. d Growth of co-culture of parent strain and ΔksgA E. coli on an agar plate (left) and a plate containing kanamycin (right), which selects for ΔksgA E. coli only. e False-colored red and green fluorescence images of co-culture after MR-FISH. Scale bar: 10 μm. f Histogram of two-color ratios of the co-culture (n = 625 cells), fitted to a bimodal Gaussian distribution with centers and widths defined as in (b). g Comparison of the fraction of ΔksgA E. coli in co-culture as measured by colony counting and MR-FISH. The means and standard deviations from each technique are plotted (n = 5 technical replicates)

