Figure 6.
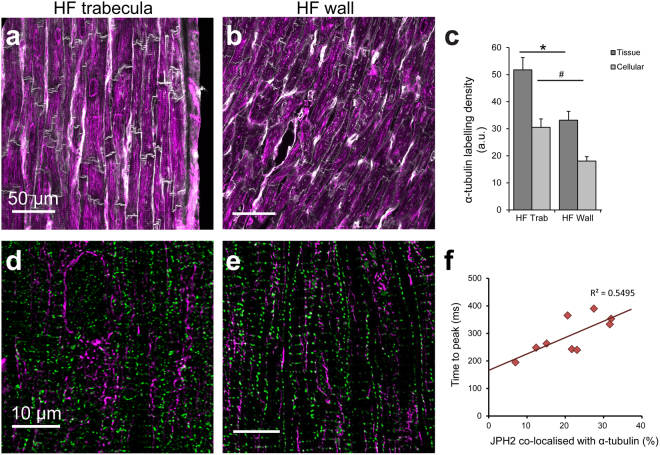
α-tubulin labelling and co-localisation with JPH2. Confocal images of α-tubulin (magenta) in (a) failing trabeculae and (b) failing ventricle wall, with cell boundaries shown by WGA (grey). (c) Density analysis of α-tubulin labelling at both the tissue and cellular level in the failing tissue sample groups. Tissue density analysis: Trabeculae: n = 14 images, 14 trabeculae, 5 hearts; failing wall n = 15 images, 5 hearts. Cellular density analysis: Trabeculae: n = 24 images, 14 trabeculae, 5 hearts; failing wall n = 27 images, 5 hearts. Data displayed as mean ± SEM. *p = 0.03; #p = 0.01. Deconvolved confocal images showing dual labelling with JPH2 (green) in (d) a trabecula and (e) ventricular myocardium from the failing heart. (f) The percentage of JPH2 co-localised with α-tubulin was strongly correlated with increased time-to-peak stress in failing trabeculae (p = 0.017).

