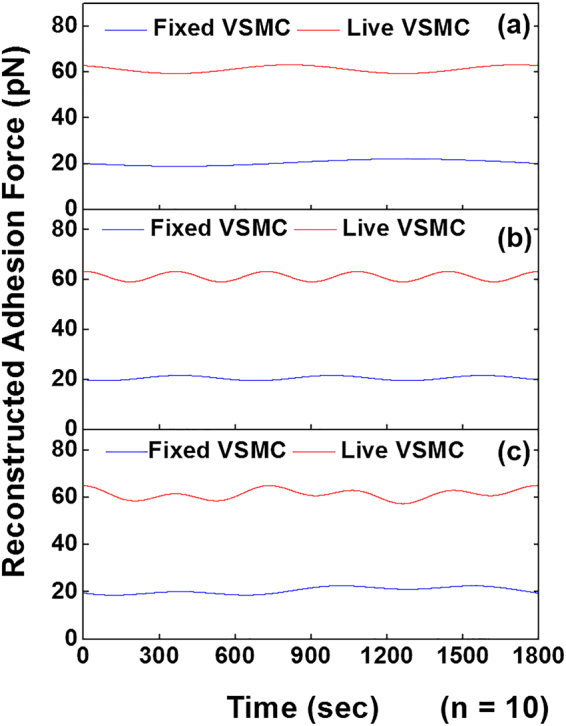
Figure 7.

Sinusoidal reconstruction of the time series integrin-FN total adhesion force. (a) Oscillatory component 1, (b) component 2 and (c) the sum of the two leading components for live VSMCs (red) and fixed VSMCs (blue). Time series adhesion data were plotted using the oscillation parameters for the first two leading components obtained from the summarized result of the SSA-FFT performed on the two group samples, respectively (n = 10). The result demonstrated the significant oscillations in the time series adhesion force for live VSMCs compared to the relative flat profile of the total adhesion force for fixed VSMCs.
