
Figure 9.
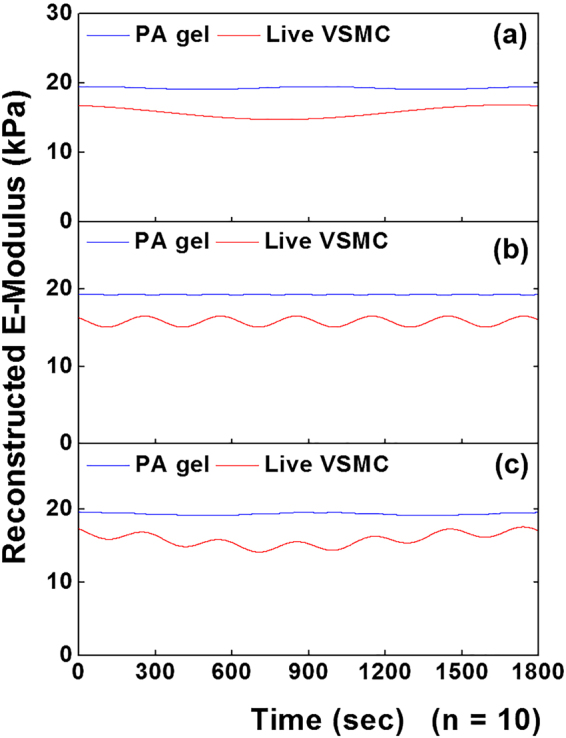
Sinusoidal reconstruction of E-modulus time series. (a) Oscillatory component 1, (b) component 2, and (c) sum of the two leading components for live VSMCs (red) and PA gel control (blue) (n = 10). The sum of components were plotted using the oscillation parameters obtained from the summarized result of the SSA-FFT process, respectively. The result showed the notable oscillations in the time series E-modulus for live VSMCs compared to the constant E-modulus for PA gel during the measurement.