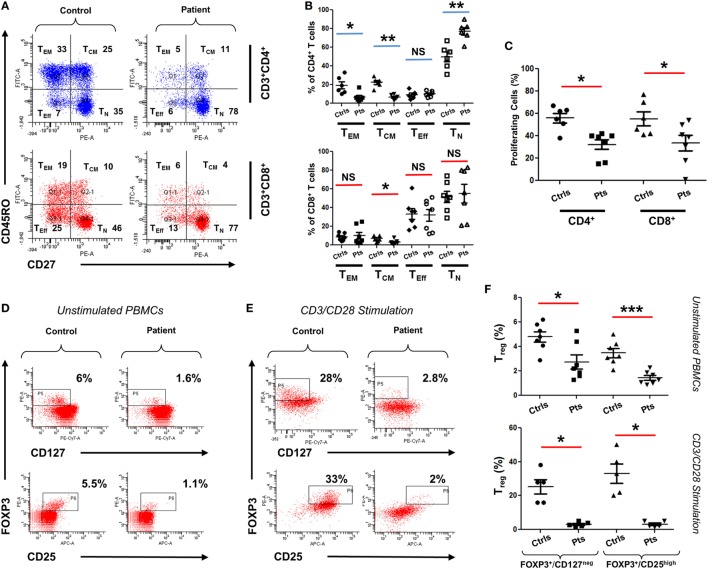
Figure 3.
Immunophenotyping of CARMIL2-deficient T cells. (A) Representative plot of viable PBMCs from one control and one patient, gated as shown then stained with CD45RO/CD27 to determine T cell subtype population numbers. Plots show CD4 and CD8 T cells that are naïve (TN, CD45RO−CD27+), central memory (TCM, CD45RO+CD27+), effector memory (TEM, CD45RO+CD27−), and effector (TEff, CD45RO−CD27−). Corresponding percentages are indicated in each quadrant. (B) Summary of CD45RO/CD27 staining data from CARMIL2 patients (n = 7), along with healthy controls (n = 6), separated based on CD4/CD8 subtype. Asterisks indicate significance levels (*p < 0.05, **p < 0.01, and ***p < 0.001) and NS denotes not significant. (C) Summary of CFSE proliferation data on PBMCs from controls and patients, following CD3/CD28 stimulation for 72 h. Representative plots showing Treg cell counts on a control and a patient, using unstimulated (D) and 72 h-stimulated (E) PBMCs. Viable cells were gated on CD4+ and were stained with FOXP3/CD25 and FOXP3/CD127 as indicated. Corresponding percentages are provided in each square. (F) Summary of Treg cell count data for unstimulated as well as CD3/CD28-stimulated groups. Data are separated based on FOXP3+/CD127low or FOXP3+/CD25high staining.

