FIGURE 3.

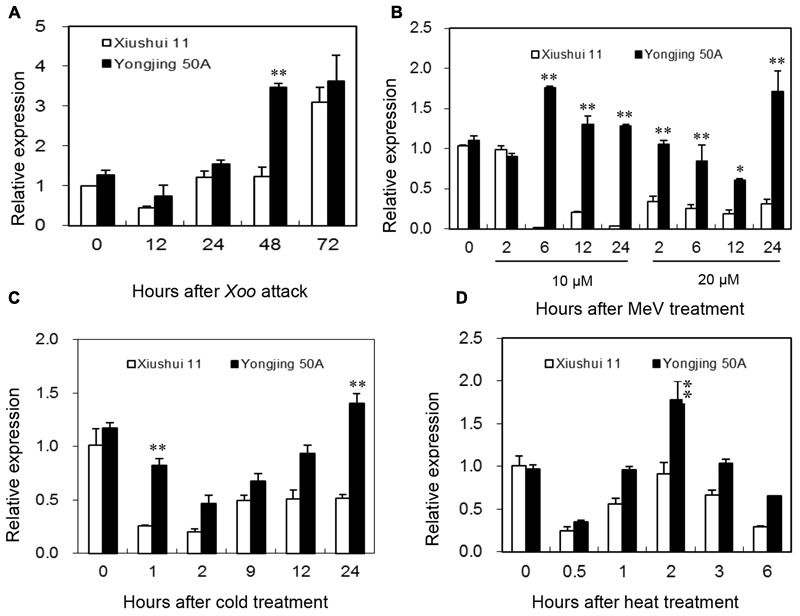
Expression of the OsGRX20 gene in leaves in response to stress. Expression patterns of OsGRX20 in two contrasting genotypes in response to Xoo strain-Zhe173 infection (A), MeV treatments (B), cold (C) or heat (D). The transcript level was firstly normalized using β-actin as an internal reference, and then made relative to the amount of corresponding mRNAs in 0 h sample. Bars represent means (three replicates) ± SD. The asterisks indicate that a significant difference was detected between two genotypes (∗p < 0.05; ∗∗p < 0.01).
