FIGURE 4.

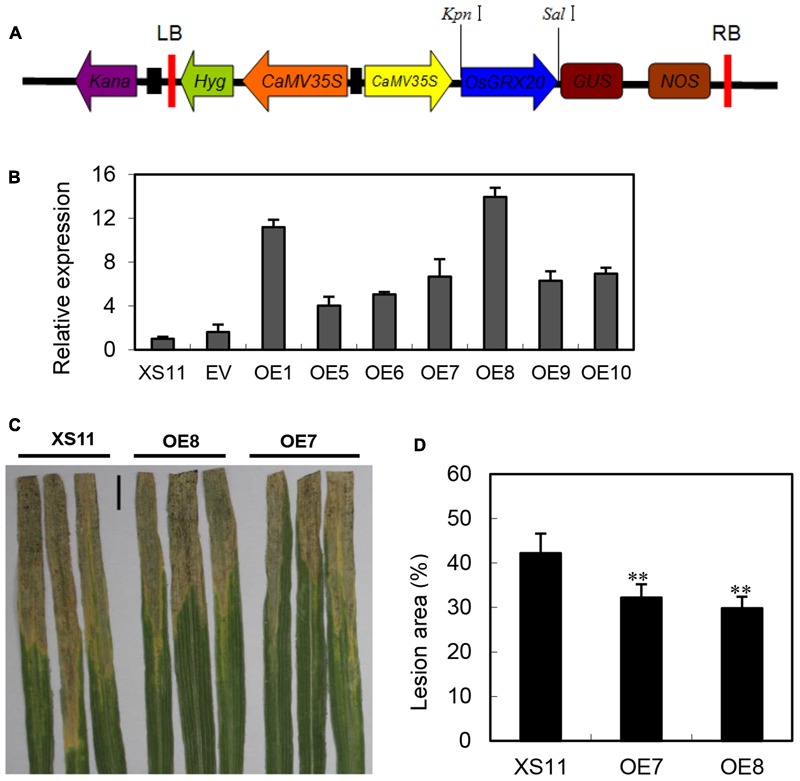
Overexpression of OsGRX20 enhanced rice resistance to Xoo infection. (A) Schematic diagram of the OsGRX20-pCAMBIA1301 overexpression construct. (B) The transcript level of OsGRX20 in T1 transgenic lines is relative to that in wild-type Xiushui 11 (XS11). Bars represent means (three to five replicates) ± SD. Lesion phenotype (C) and lesion area (D) in OsGRX20-overexpressing lines OE7 and OE8 compared with wild-type Xiushui 11 (XS11). The flag leaves at the booting stage were inoculated with Xoo strain-PXO66 for 21 days. The black bar represents 2 cm. The double asterisks indicate that a significant difference (p < 0.01) in the lesion area was detected between transgenic plants and the respective wild -type. Data represent mean ± SD from three independent biological replicates.
