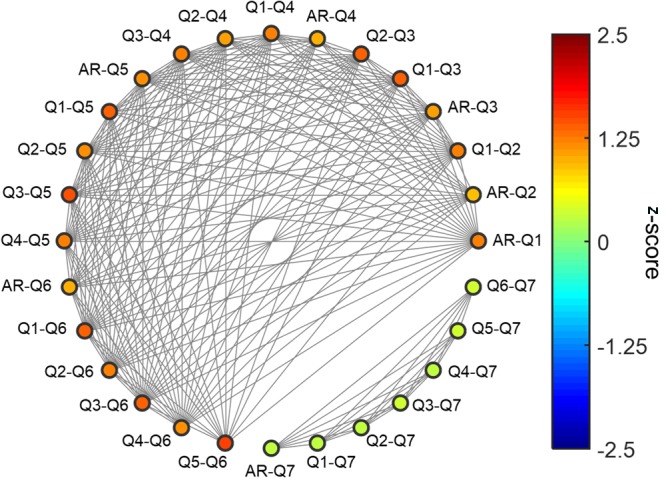
FIGURE 4.

A diagram of 28 correlation coefficients between eight questions. A total of 28 correlation coefficients of behavioral responses between every possible pair of eight questions (seven questions and the AR) were represented as the nodes (colored circles). Each node was color-coded using the z-score of the correlation coefficients. A pair of nodes was connected by gray lines if there were no significant differences between the correlation coefficients of the nodes (z-scores, p < 0.05).
