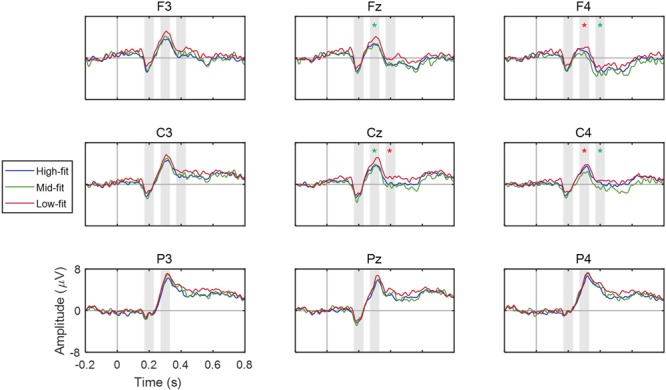
FIGURE 5.

ERP waveforms of nine EEG channel locations. The mean ERP waveforms across participants were obtained for each fit group and each channel. The vertical bars at 0 s denote the onset of stimulus (extended service; S2). Red and green asterisk marks (∗) indicate a significant difference (p < 0.05) and a trend of difference (p < 0.10) between low and high fit groups, respectively. The shaded areas represent the ERP components observed in this study.
